Adventures in processing with prender
Mar 7th, 2010
First, I’m overdue in announcing Transit to Go a.k.a. “the iPhone transit map that’s demonstrably more useful than a paper schedule” a.k.a. “your bus departure in 15 seconds or less, no matter where you are”. I wrote up a blog post about it for Mindsea‘s site, if you’re interested in finding out more.
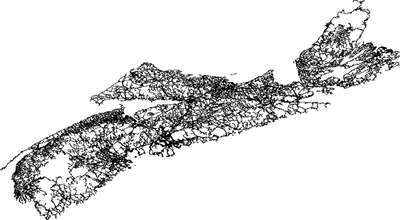
Second, all this transit excitement has made me start thinking about better routing and geometry algorithms again. I’ve been experimenting a bit with Brandon Martin Anderson’s prender framework, used by the infamous Graphserver, and have been pretty happy with the results. It basically lets you do processing visualizations in python (i.e. no Java coding required). Here’s a quick picture of it in action, rendering the Nova Scotian road network, as distributed by geobase.

The neat thing about this framework is that you can render quickly to an arbitrary level of detail, which should prove very useful when troubleshooting the behavior of some of the code I’m working on. If anyone is interested in running the framework on MacOS X (like I was), my fork of the project has the appropriate patches.