Automatically measuring startup / load time with Eideticker
Oct 17th, 2013
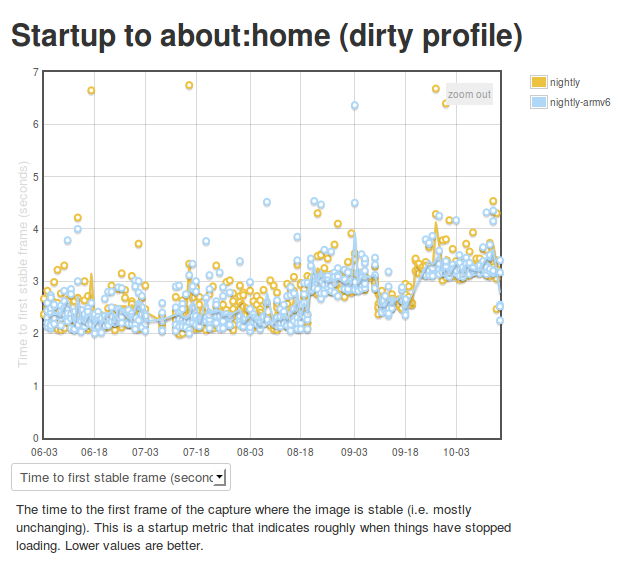
So we’ve been using Eideticker to automatically measure startup/pageload times for about a year now on Android, and more recently on FirefoxOS as well (albeit not automatically). This gives us nice and pretty graphs like this:
Ok, so we’re generating numbers and graphing them. That’s great. But what’s really going on behind the scenes? I’m glad you asked. The story is a bit different depending on which platform you’re talking about.
Android
On Android we connect Eideticker to the device’s HDMI out, so we count on a nearly pixel-perfect signal. In practice, it isn’t quite, but it is within a few RGB values that we can easily filter for. This lets us come up with a pretty good mechanism for determining when a page load or app startup is finished: just compare frames, and say we’ve “stopped” when the pixel differences between frames are negligible (previously defined at 2048 pixels, now 4096 — see below). Eideticker’s new frame difference view lets us see how this works. Look at this graph of application startup:
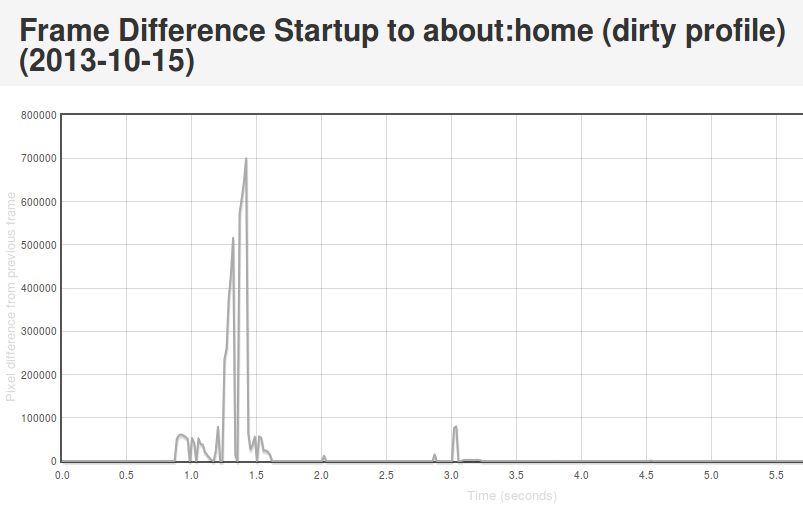
What’s going on here? Well, we see some huge jumps in the beginning. This represents the animated transitions that Android makes as we transition from the SUTAgent application (don’t ask) to the beginnings of the FirefoxOS browser chrome. You’ll notice though that there’s some more changes that come in around the 3 second mark. This is when the site bookmarks are fully loaded. If you load the original page (link above) and swipe your mouse over the graph, you can see what’s going on for yourself.
This approach is not completely without problems. It turns out that there is sometimes some minor churn in the display even when the app is for all intents and purposes started. For example, sometimes the scrollbar fading out of view can result in a significantish pixel value change, so I recently upped the threshold of pixels that are different from 2048 to 4096. We also recently encountered a silly problem with a random automation app displaying “toasts” which caused results to artificially spike. More tweaking may still be required. However, on the whole I’m pretty happy with this solution. It gives useful, undeniably objective results whose meaning is easy to understand.
FirefoxOS
So as mentioned previously, we use a camera on FirefoxOS to record output instead of HDMI output. Pretty unsurprisingly, this is much noisier. See this movie of the contacts app starting and note all the random lighting changes, for example:
My experience has been that pixel differences can be so great between visually identical frames on an eideticker capture on these devices that it’s pretty much impossible to settle on when startup is done using the frame difference method. It’s of course possible to detect very large scale changes, but the small scale ones (like the contacts actually appearing in the example above) are very hard to distinguish from random differences in the amount of light absorbed by the camera sensor. Tricks like using median filtering (a.k.a. “blurring”) help a bit, but not much. Take a look at this graph, for example:
You’ll note that the pixel differences during “static” parts of the capture are highly variable. This is because the pixel difference depends heavily on how “bright” each frame is: parts of the capture which are black (e.g. a contacts icon with a black background) have a much lower difference between them than parts that are bright (e.g. the contacts screen fully loaded).
After a day or so of experimenting and research, I settled on an approach which seems to work pretty reliably. Instead of comparing the frames directly, I measure the entropy of the histogram of colours used in each frame (essentially just an indication of brightness in this case, see this article for more on calculating it), then compare that of each frame with the average of the same measure over 5 previous frames (to account for the fact that two frames may be arbitrarily different, but that is unlikely that a sequence of frames will be). This seems to work much better than frame difference in this environment: although there are plenty of minute differences in light absorption in a capture from this camera, the overall color composition stays mostly the same. See this graph:
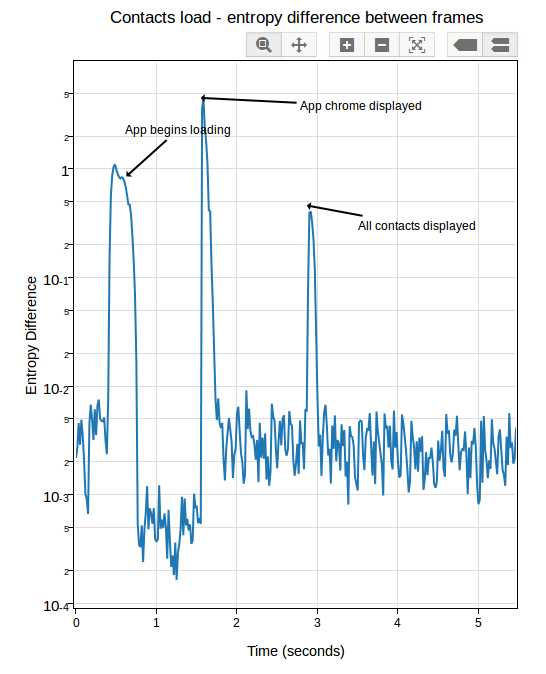
If you look closely, you can see some minor variance in the entropy differences depending on the state of the screen, but it’s not nearly as pronounced as before. In practice, I’ve been able to get extremely consistent numbers with a reasonable “threshold” of “0.05”.
In Eideticker I’ve tried to steer away from using really complicated math or algorithms to measure things, unless all the alternatives fail. In that sense, I really liked the simplicity of “pixel differences” and am not thrilled about having to resort to this: hopefully the concepts in this case (histograms and entropy) are simple enough that most people will be able to understand my methodology, if they care to. Likely I will need to come up with something else for measuring responsiveness and animation smoothness (frames per second), as likely we can’t count on light composition changing the same way for those cases. My initial thought was to use edge detection (which, while somewhat complex to calculate, is at least easy to understand conceptually) but am open to other ideas.