Measuring e10s vs. non-e10s performance with Perfherder
Feb 18th, 2015
For the past few months I’ve been working on a sub-project of Treeherder called Perfherder, which aims to provide a workflow that will let us more easily detect and manage performance regressions in our products (initially just those detected in Talos, but there’s room to expand on that later). This is a long term project and we’re still sorting out the details of exactly how it will work, but I thought I’d quickly announce a milestone.
As a first step, I’ve been hacking on a graphical user interface to visualize the performance data we’re now storing inside Treeherder. It’s pretty bare bones so far, but already it has two features which graphserver doesn’t: the ability to view sub-test results (i.e. the page load time for a specific page in the tp5 suite, as opposed to the geometric mean of all of them) and the ability to see results for e10s builds.
Here’s an example, comparing the tp5o 163.com page load times on windows 7 with e10s enabled (and not):
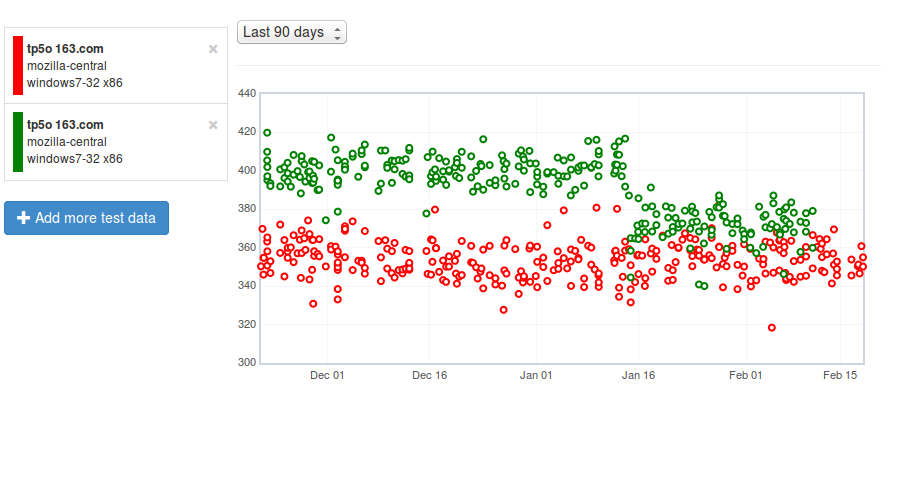
Green is e10s, red is non-e10s (the legend picture doesn’t reflect this because we have yet to deploy a fix to bug 1130554, but I promise I’m not lying). As you can see, the gap has been closing (in particular, something landed in mid-January that improved the e10s numbers quite a bit), but page load times are still measurably slower with this feature enabled.