Showing posts tagged Mozilla
House keeping news: I’m moving this blog back to the wrla.ch domain from wlach.github.io. This domain sorta kinda worked before (I set up a netlify deploy a couple years ago), but the software used to generate this blog referenced github all over the place in its output, so it didn’t really work as you’d expect. Anyway, this will be the last entry published on wlach.github.io: my plan is to turn that domain into a set of redirects in the future.
I don’t know how many of you are out there who still use RSS, but if you do, please update your feeds. I have filed a bug to update my Planet Mozilla entry, so hopefully the change there will be seamless.
Why? Recent events have made me not want to tie my public web presence to a particular company (especially a larger one, like Microsoft). I don’t have any immediate plans to move this blog off of github, but this gives me that option in the future. For those wondering, the original rationale for moving to github is in this post. Looking back, the idea of moving away from a VPS and WordPress made sense, the move away from my own domain less so. I think it may have been harder to set up static hosting (esp. with HTTPS) at that time… or I might have just been ignorant.
In related news, I decided to reactivate my twitter account: you can once again find me there as @wrlach (my old username got taken in my absence). I’m not totally thrilled about this (I basically stand by what I wrote a few years ago, except maybe the concession I made to Facebook being “ok”), but Twitter seems to be where my industry peers are. As someone who doesn’t have a large organic following, I’ve come to really value forums where I can share my work. That said, I’m going to be very selective about what I engage with on that site: I appreciate your understanding.
It’s coming up on ten years at Mozilla for me, by far the longest I’ve held any job personally and exceedingly long by the standards of the technology industry. When I joined up in Summer 2011 to work on Engineering Productivity1, I really did see it as a dream job: I’d be paid to work full time on free software, which (along with open data and governance) I genuinely saw as one of the best hopes for the future. I was somewhat less sure about Mozilla’s “mission”: the notion of protecting the “open web” felt nebulous and ill-defined and the Mozilla Manifesto seemed vague when it departed from the practical aspects of shipping a useful open source product to users.
It seems ridiculously naive in retrospect, but I can remember thinking at the time that the right amount of “open source” would solve all the problems. What can I say? It was the era of the Arab Spring, WikiLeaks had not yet become a scandal, Google still felt like something of a benevolent upstart, even Facebook’s mission of “making the world more connected” sounded great to me at the time. If we could just push more things out in the open, then the right solutions would become apparent and fixing the structural problems society was facing would become easy!
What a difference a decade makes. The events of the last few years have demonstrated (conclusively, in my view) that open systems aren’t necessarily a protector against abuse by governments, technology monopolies and ill-intentioned groups of individuals alike. Amazon, Google and Facebook are (still) some of the top contributors to key pieces of open source infrastructure but it’s now beyond any doubt that they’re also responsible for amplifying a very large share of the problems global society is experiencing.
At the same time, some of the darker sides of open source software development have become harder and harder to ignore. In particular:
- Harassment and micro aggressions inside open source communities is rampant: aggressive behaviour in issue trackers, personal attacks on discussion forums, the list goes on. Women and non-binary people are disproportionately affected, although this behaviour exacts a psychological toll on everyone.
- Open source software as exploitation: I’ve worked with lots of contributors while at Mozilla. It’s hard to estimate this accurately, but based on some back-of-the-envelope calculations, I’d estimate that the efforts of community volunteers on projects I’ve been involved in have added up to (conservatively) to hundreds of thousands of U.S. dollars in labour which has never been directly compensated monetarily. Based on this experience (as well as what I’ve observed elsewhere), I’d argue that Mozilla as a whole could not actually survive on a sustained basis without unpaid work, which (at least on its face) seems highly problematic and creates a lingering feeling of guilt given how much I’ve benefited financially from my time here.
- It’s a road to burnout. Properly managing and nurturing an open source community is deeply complex work, involving a sustained amount of both attention and emotional labour — this is difficult glue work that is not always recognized or supported by peers or management. Many of the people I’ve met over the years (community volunteers and Mozilla employees alike) have ended up feeling like it just isn’t worth the effort and have either stopped doing it or have outright left Mozilla. If it weren’t for an intensive meditation practice which I established around the time I started working here, I suspect I would have been in this category by now.
All this has led to a personal crisis of faith. Do openness and transparency inherently lead to bad outcomes? Should I continue to advocate for it in my position? As I mentioned above, the opportunity to work in the open with the community is the main thing that brought me to Mozilla— if I can’t find a way of incorporating this viewpoint into my work, what am I even doing here?
Trying to answer these questions, I went back to the manifesto that I just skimmed over in my early days. Besides openness — what are Mozilla’s values, really, and do I identify with them? Immediately I was struck by how much it felt like it was written explicitly for the present moment (even aside from the addendums which were added in 2018). Many points seem to confront problems we’re grappling with now which I was only beginning to perceive ten years ago.
Beyond that, there was also something that resonated with me on a deeper level. There were a few points, highlighted in bold, that really stood out:
- The internet is an integral part of modern life—a key component in education, communication, collaboration, business, entertainment and society as a whole.
- The internet is a global public resource that must remain open and accessible.
- The internet must enrich the lives of individual human beings.
- Individuals’ security and privacy on the internet are fundamental and must not be treated as optional.
- Individuals must have the ability to shape the internet and their own experiences on the internet.
- The effectiveness of the internet as a public resource depends upon interoperability (protocols, data formats, content), innovation and decentralized participation worldwide.
- Free and open source software promotes the development of the internet as a public resource.
- Transparent community-based processes promote participation, accountability and trust.
- Commercial involvement in the development of the internet brings many benefits; a balance between commercial profit and public benefit is critical.
- Magnifying the public benefit aspects of the internet is an important goal, worthy of time, attention and commitment.
I think it’s worth digging beneath the surface of these points: what is the underlying value system behind them? I’d argue it’s this, simply put: human beings really do matter. They’re not just line items in a spreadsheet or some other resource to be optimized. They are an end in of themselves. People (more so than a software development methodology) are the reason why I show up every day to do the work that I do. This is really an absolute which has enduring weight: it’s a foundational truth of every major world religion to say nothing of modern social democracy.
What does working and building in then open mean then? As we’ve seen above, it certainly isn’t something I’d consider “good” all by itself. Instead, I’d suggest it’s a strategy which (if we’re going to follow it) should come out of that underlying recognition of the worth of Mozilla’s employees, community members, and users. Every single one of these people matter, deeply. I’d argue then, that Mozilla should consider the following factors in terms of how we work in the open:
- Are our spaces2 generally safe for people of all backgrounds to be their authentic selves? This not only means free from sexual harassment and racial discrimination, but also that they’re able to work to their full potential. This means creating opportunities for everyone to climb the contribution curve, among other things.
- We need to be more honest and direct about the economic benefits that community members bring to Mozilla. I’m not sure exactly what this means right now (and of course Mozilla’s options are constrained both legally and economically), but we need to do better about acknowledging their contributions to Mozilla’s bottom line and making sure there is a fair exchange of value on both sides. At the very minimum, we need to make sure that people’s contributions help them grow professionally or otherwise if we can’t guarantee monetary compensation for their efforts.
- We need to acknowledge the efforts that our employees make in creating functional communities. This work does not come for free and we need to start acknowledging it in both our career development paths and when looking at individual performance. Similarly, we need to provide better guidance and mentorship on how to do this work in a way that does not extract too hard a personal toll on the people involved — this is a complex topic, but a lot of it in my opinion comes down to better onboarding practices (which is something we should be doing anyway) as well as setting better boundaries (both in terms of work/life balance, as well as what you’ll accept in your interactions).
- Finally, what is the end result of our work? Do the software and systems we build genuinely enrich people’s lives? Do they become better informed after using our software? Do they make them better decisions? Free software might be good in itself, but one must also factor in how it is used when measuring its social utility (see: Facebook).
None of the above is easy to address. But the alternatives are either close everything down to public participation (which I’d argue will lead to the death of Mozilla as an organization: it just doesn’t have the resources to compete in the marketplace without the backing of the community) or continue down the present path (which I don’t think is sustainable either). The last ten years have shown that the “open source on auto-pilot” approach just doesn’t work.
I suspect these problems aren’t specific to Mozilla and affect other communities that work in the open. I’d be interested in hearing other perspectives on this family of problems: if you have anything to add, my contact information is below.
(“This Week in Glean” is a series of blog posts that the Glean Team at Mozilla is using to try to communicate better about our work. They could be release notes, documentation, hopes, dreams, or whatever: so long as it is inspired by Glean. You can find an index of all TWiG posts online.)
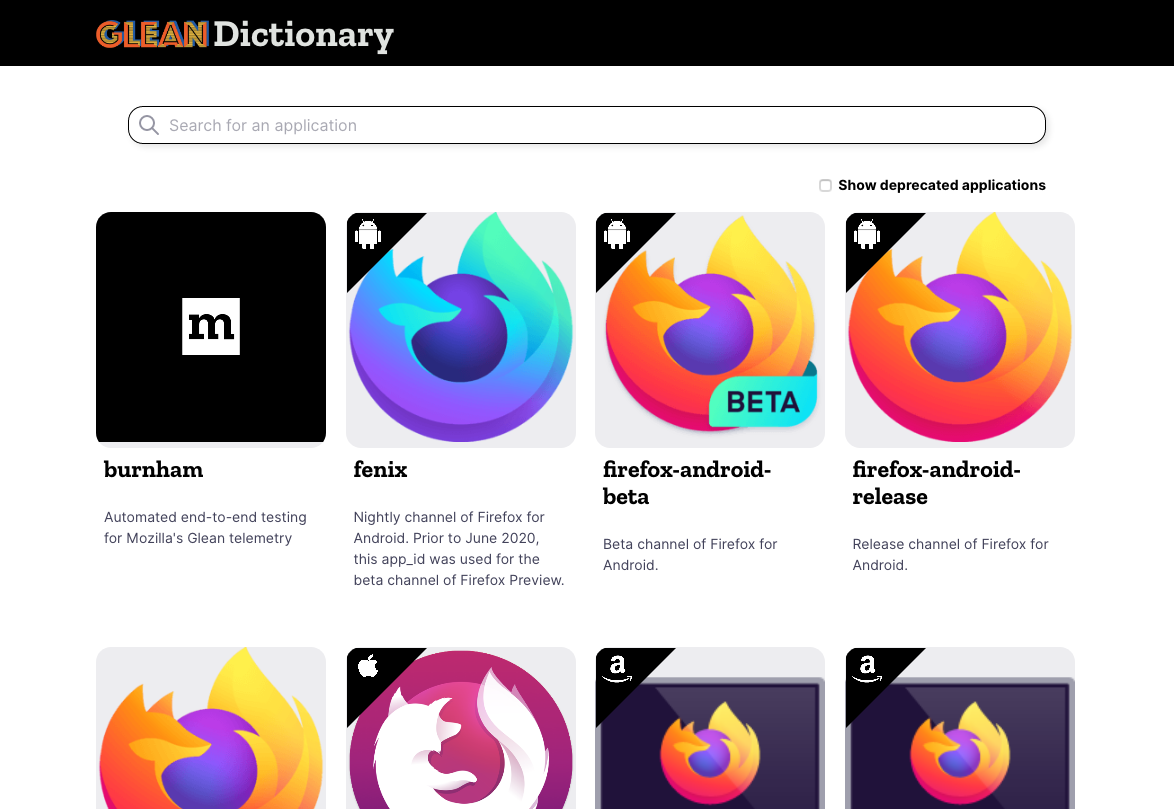
On behalf of Mozilla’s Data group, I’m happy to announce the availability of the first milestone of the Glean Dictionary, a project to provide a comprehensive “data dictionary” of the data Mozilla collects inside its products and how it makes use of it. You can access it via this development URL:
https://dictionary.protosaur.dev/
The goal of this first milestone was to provide an equivalent to the popular “probe” dictionary for newer applications which use the Glean SDK, such as Firefox for Android. As Firefox on Glean (FoG) comes together, this will also serve as an index of what data is available for Firefox and how to access it.
Part of the vision of this project is to act as a showcase for Mozilla’s practices around lean data and data governance: you’ll note that every metric and ping in the Glean Dictionary has a data review associated with it — giving the general public a window into what we’re collecting and why.
In addition to displaying a browsable inventory of the low-level metrics which these applications collect, the Glean Dictionary also provides:
- Code search functionality (via Searchfox) to see where any given data collection is defined and used.
- Information on how this information is represented inside Mozilla’s BigQuery data store.
- Where available, links to browse / view this information using the Glean Aggregated Metrics Dashboard (GLAM).
Over the next few months, we’ll be expanding the Glean Dictionary to include derived datasets and dashboards / reports built using this data, as well as allow users to add their own annotations on metric behaviour via a GitHub-based documentation system. For more information, see the project proposal.
The Glean Dictionary is the result of the efforts of many contributors, both inside and outside Mozilla Data. Special shout-out to Linh Nguyen, who has been moving mountains inside the codebase as part of an Outreachy internship with us. We welcome your feedback and involvement! For more information, see our project repository and Matrix channel (#glean-dictionary on chat.mozilla.org).
A bit belatedly, I thought I’d write a short retrospective on Iodide: an effort to create a compelling, client-centred scientific notebook environment.
Despite not writing a ton about it (the sole exception being this brief essay about my conservative choice for the server backend) Iodide took up a very large chunk of my mental energy from late 2018 through 2019. It was also essentially my only attempt at working on something that was on its way to being an actual product while at Mozilla: while I’ve led other projects that have been interesting and/or impactful in my 9 odd-years here (mozregression and perfherder being the biggest successes), they fall firmly into the “internal tools supporting another product” category.
At this point it’s probably safe to say that the project has wound down: no one is being paid to work on Iodide and it’s essentially in extreme maintenance mode. Before it’s put to bed altogether, I’d like to write a few notes about its approach, where I think it had big advantanges, and where it seems to fall short. I’ll conclude with some areas I’d like to explore (or would like to see others explore!). I’d like to emphasize that this is my opinion only: the rest of the Iodide core team no doubt have their own thoughts. That said, let’s jump in.
What is Iodide, anyway?
One thing that’s interesting about a product like Iodide is that people tend to project their hopes and dreams onto it: if you asked any given member of the Iodide team to give a 200 word description of the project, you’d probably get a slightly different answer emphasizing different things. That said, a fair initial approximation of the project vision would be “a scientific notebook like Jupyter, but running in the browser”.
What does this mean? First, let’s talk about what Jupyter does: at heart, it’s basically a Python “kernel” (read: interpreter), fronted by a webserver. You send snipits of the code to the interpreter via a web interface and they would faithfully be run on the backend (either on your local machine in a separate process or a server in the cloud). Results are then be returned back to the web interface and then rendered by the browser in one form or another.
Iodide’s model is quite similar, with one difference: instead of running the kernel in another process or somewhere in the cloud, all the heavy lifting happens in the browser itself, using the local JavaScript and/or WebAssembly runtime. The very first version of the product that Hamilton Ulmer and Brendan Colloran came up with was definitely in this category: it had no server-side component whatsoever.
Truth be told, even applications like Jupyter do a fair amount of computation on the client side to render a user interface and the results of computations: the distinction is not as clear cut as you might think. But in general I think the premise holds: if you load an iodide notebook today (still possible on alpha.iodide.io! no account required), the only thing that comes from the server is a little bit of static JavaScript and a flat file delivered as a JSON payload. All the “magic” of whatever computation you might come up with happens on the client.
Let’s take a quick look at the default tryit iodide notebook to give an idea of what I mean:
%% fetch
// load a js library and a csv file with a fetch cell
js: https://cdnjs.cloudflare.com/ajax/libs/d3/4.10.2/d3.js
text: csvDataString = https://data.sfgov.org/api/views/5cei-gny5/rows.csv?accessType=DOWNLOAD

%% js
// parse the data using the d3 library (and show the value in the console)
parsedData = d3.csvParse(csvDataString)

%% js
// replace the text in the report element "htmlInMd"
document.getElementById('htmlInMd').innerText = parsedData[0].Address

%% py
# use python to select some of the data
from js import parsedData
[x['Address'] for x in parsedData if x['Lead Remediation'] == 'true']
The %% delimiters indicate individual cells. The fetch cell is an iodide-native cell with its own logic to load the specified resources into a JavaScript variables when evaluated. js and py cells direct the browser to interpret the code inside of them, which causes the DOM to mutate. From these building blocks (and a few others), you can build up an interactive report which can also be freely forked and edited by anyone who cares to.
In some ways, I think Iodide has more in common with services like Glitch or Codepen than with Jupyter. In effect, it’s mostly offering a way to build up a static web page (doing whatever) using web technologies— even if the user interface affordances and cell-based computation model might remind you more of a scientific notebook.
What works well about this approach
There’s a few nifty things that come from doing things this way:
- The environment is easily extensible for those familiar with JavaScript or other client side technologies. There is no need to mess with strange plugin architectures or APIs or conform to the opinions of someone else on what options there are for data visualization and presentation. If you want to use jQuery inside your notebook for a user interface widget, just import it and go!
- The architecture scales to many, many users: since all the computation happens on the client, the server’s only role is to store and retrieve notebook content. alpha.iodide.io has happily been running on Heroku’s least expensive dyno type for its entire existence.
- Reproducibility: so long as the iodide notebook has no references to data on third party servers with authentiction, there is no stopping someone from being able to reproduce whatever computations led to your results.
- Related to reproducibility, it’s easy to build off of someone else’s notebook or exploration, since everything is so self-contained.
I continue to be surprised and impressed with what people come up with in the Jupyter ecosystem so I don’t want to claim these are things that “only Iodide” (or other tools like it) can do— what I will say is that I haven’t seen many things that combine both the conciseness and expressiveness of iomd. The beauty of the web is that there is such an abundance of tutorials and resources to support creating interactive content: when building iodide notebooks, I would freely borrow from resources such as MDN and Stackoverflow, instead of being locked into what the authoring software thinks one should be able express.
What’s awkward
Every silver lining has a cloud and (unfortunately) Iodide has a pretty big one. Depending on how you use Iodide, you will almost certainly run into the following problems:
- You are limited by the computational affordances provided by the browser: there is no obvious way to offload long-running or expensive computations to a cluster of machines using a technology like Spark.
- Long-running computations will block the main thread, causing your notebook to become extremely unresponsive for the duration.
The first, I (and most people?) can usually live with. Computers are quite powerful these days and most data tasks I’m interested in are easily within the range of capabilities of my laptop. In the cases where I need to do something larger scale, I’m quite happy to fire up a Jupyter Notebook, BigQuery Console, or <other tool of choice> to do the heavy-lifting, and then move back to a client-side approach to visualize and explore my results.
The second is much harder to deal with, since it means that the process of exploration that is so key to scientific computing. I’m quite happy to wait 5 seconds, 15 seconds, even a minute for a longer-running computation to complete but if I see the slow script dialog and everything about my environment grinds to a halt, it not only blocks my work but causes me to lose faith in the system. How do I know if it’s even going to finish?
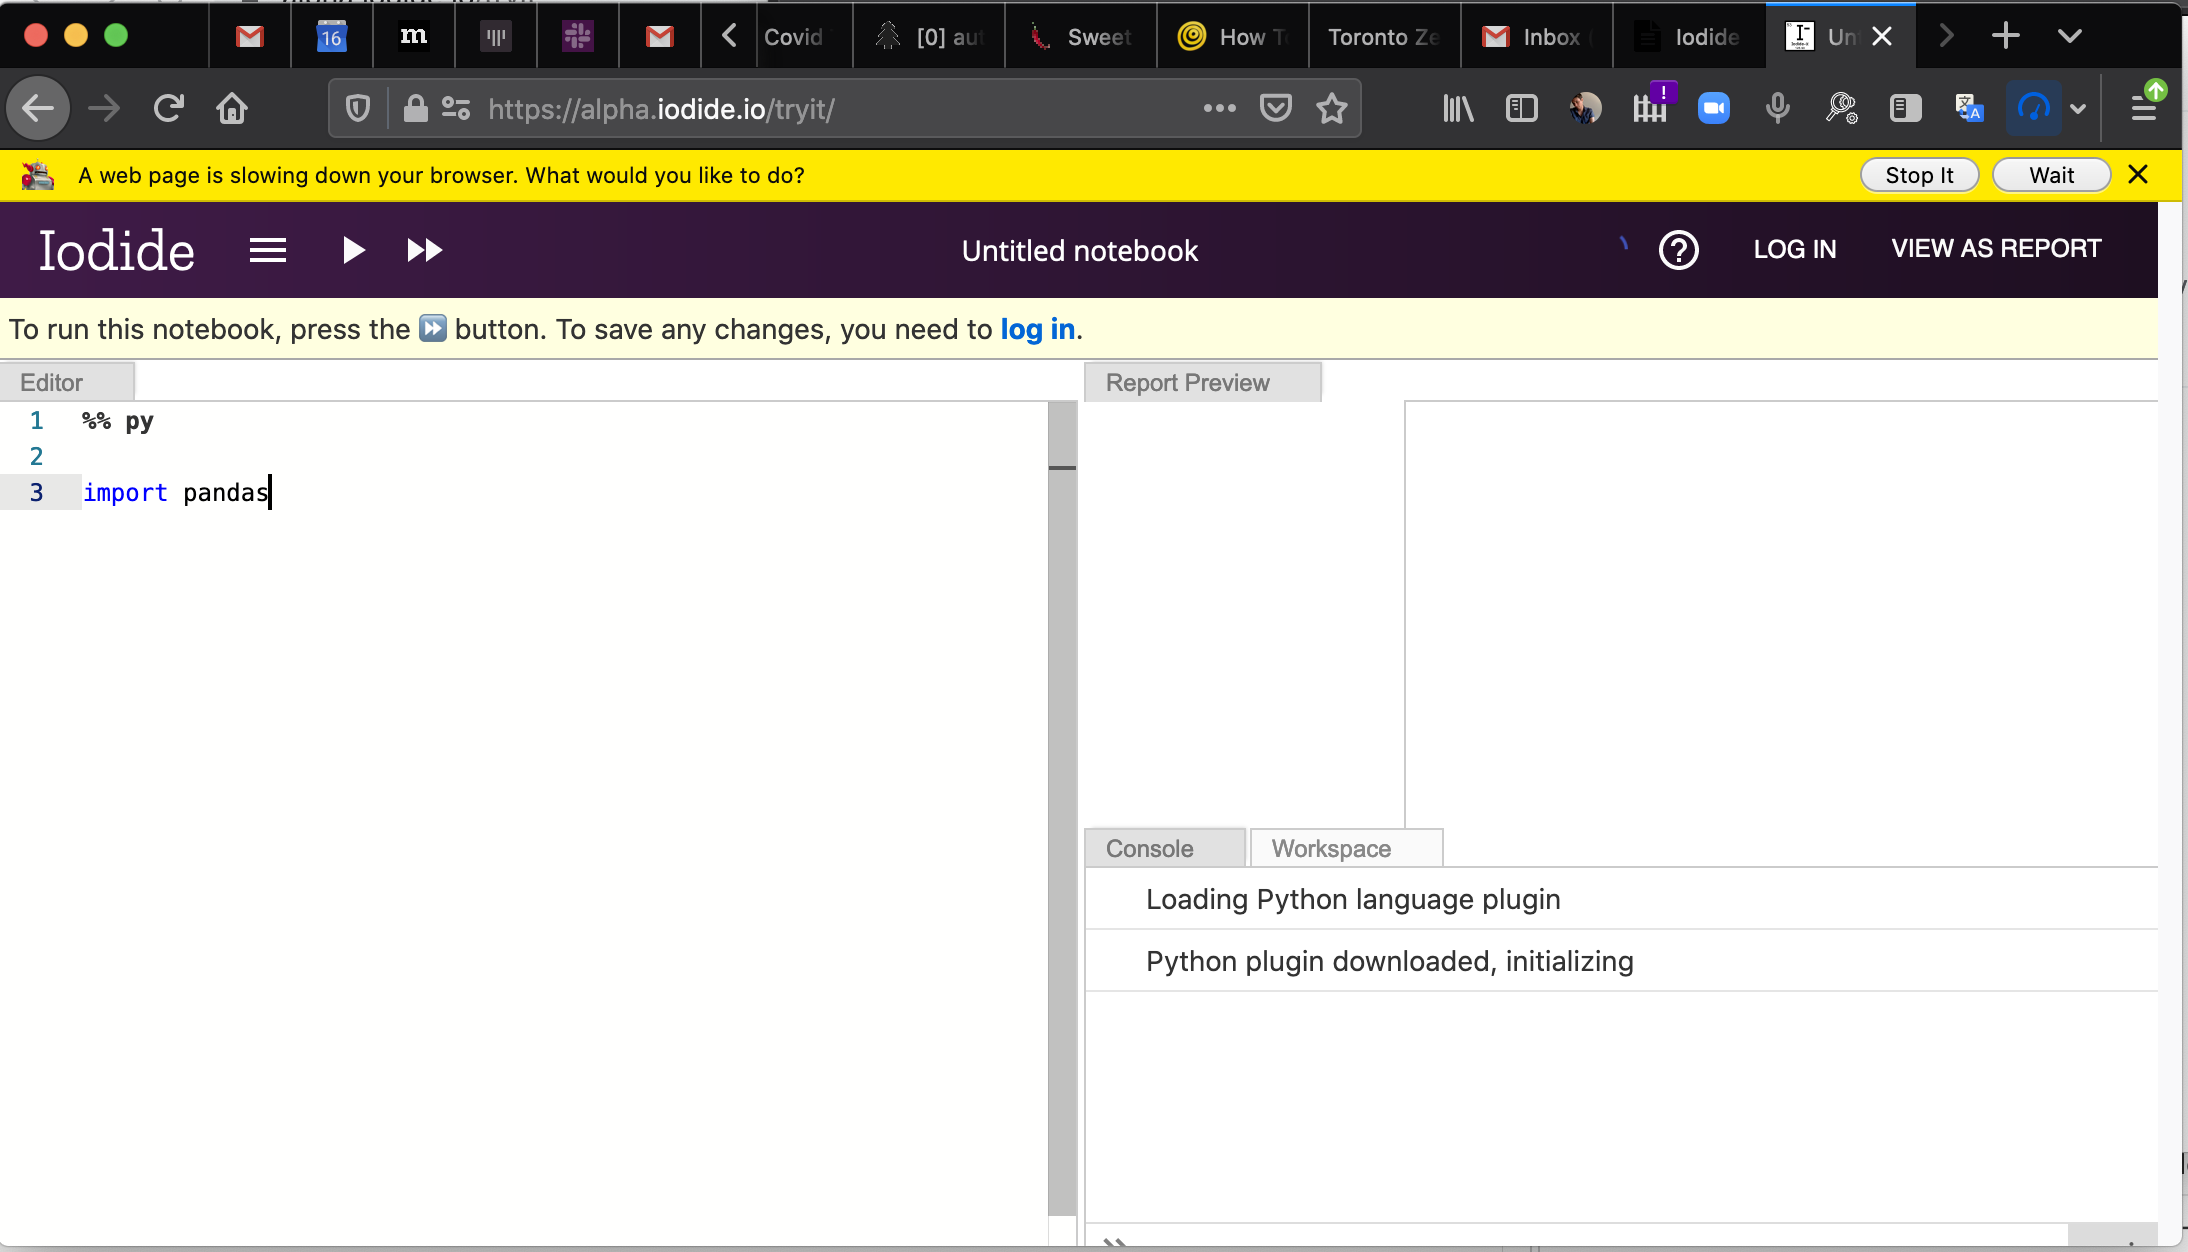
This occurs way more often than you might think: even a simple notebook loading pandas (via pyodide) can cause Firefox to pop up the slow script dialog:
Why is this so? Aren’t browsers complex beasts which can do a million things in parallel these days? Only sort of: while the graphical and network portions of loading and using a web site are highly parallel, JavaScript and any changes to the DOM can only occur synchronously by default. Let’s break down a simple iodide example which trivially hangs the browser:
%% js

while (1) { true }
link (but you really don’t want to)
What’s going on here? When you execute that cell, the web site’s sole thread is now devoted to running that infinite loop. No longer can any other JavaScript-based event handler be run, so for example the text editor (which uses Monaco under the hood) and menus are now completely unresponsive.
The iodide team was aware of this issue since I joined the project. There were no end of discussions about how to work around it, but they never really come to a satisfying conclusion. The most obvious solution is to move the cell’s computation to a web worker, but workers don’t have synchronous access to the DOM which is required for web content to work as you’d expect. While there are projects like ComLink that attempt to bridge this divide, they require both a fair amount of skill and code to use effectively. As mentioned above, one of the key differentiators between iodide and other notebook environments is that tools like jQuery, d3, etc. “just work”. That is, you can take a code snipit off the web and run it inside an iodide notebook: there’s no workaround I’ve been able to find which maintains that behaviour and ensures that the Iodide notebook environment is always responsive.
It took a while for this to really hit home, but having some separation from the project, I’ve come to realize that the problem is that the underlying technology isn’t designed for the task we were asking of it, nor is it likely to ever be in the near future. While the web (by which I mean not only the browser, but the ecosystem of popular tooling and libraries that has been built on top of it) has certainly grown in scope to things it was never envisioned to handle like games and office applications, it’s just not optimized for what I’d call “editable content”. That is, the situation where a web page offers affordances for manipulating its own representation.
While modern web browsers have evolved to (sort of) protect one errant site from bringing the whole thing down, they certainly haven’t evolved to protect a particular site against itself. And why would they? Web developers usually work in the terminal and text editor: the assumption is that if their test code misbehaves, they’ll just kill their tab and start all over again. Application state is persisted either on-disk or inside an external database, so nothing will really be lost.
Could this ever change? Possibly, but I think it would be a radical rethinking of what the web is, and I’m not really sure what would motivate it.
A way forward
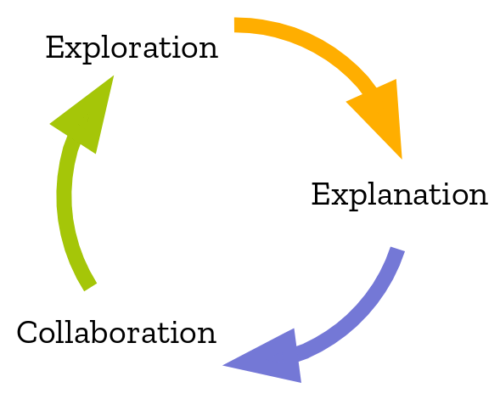
While working on iodide, we were fond of looking at this diagram, which was taken from this study of the data science workflow:
It describes how people typically perform computational inquiry: typically you would poke around with some raw data, run some transformations on it. Only after that process was complete would you start trying to build up a “presentation” of your results to your audience.
Looking back, it’s clear that Iodide’s strong suit was the explanation part of this workflow, rather than collaboration and exploration. My strong suspicion is that we actually want to use different tools for each one of these tasks. Coincidentally, this also maps to the bulk of my experience working with data at Mozilla, using iodide or not: my most successful front-end data visualization projects were typically the distilled result of a very large number of adhoc explorations (python scripts, SQL queries, Jupyter notebooks, …). The actual visualization itself contains very little computational meat: basically “just enough” to let the user engage with the data fruitfully.
Unfortunately much of my work in this area uses semi-sensitive internal Mozilla data so can’t be publicly shared, but here’s one example:
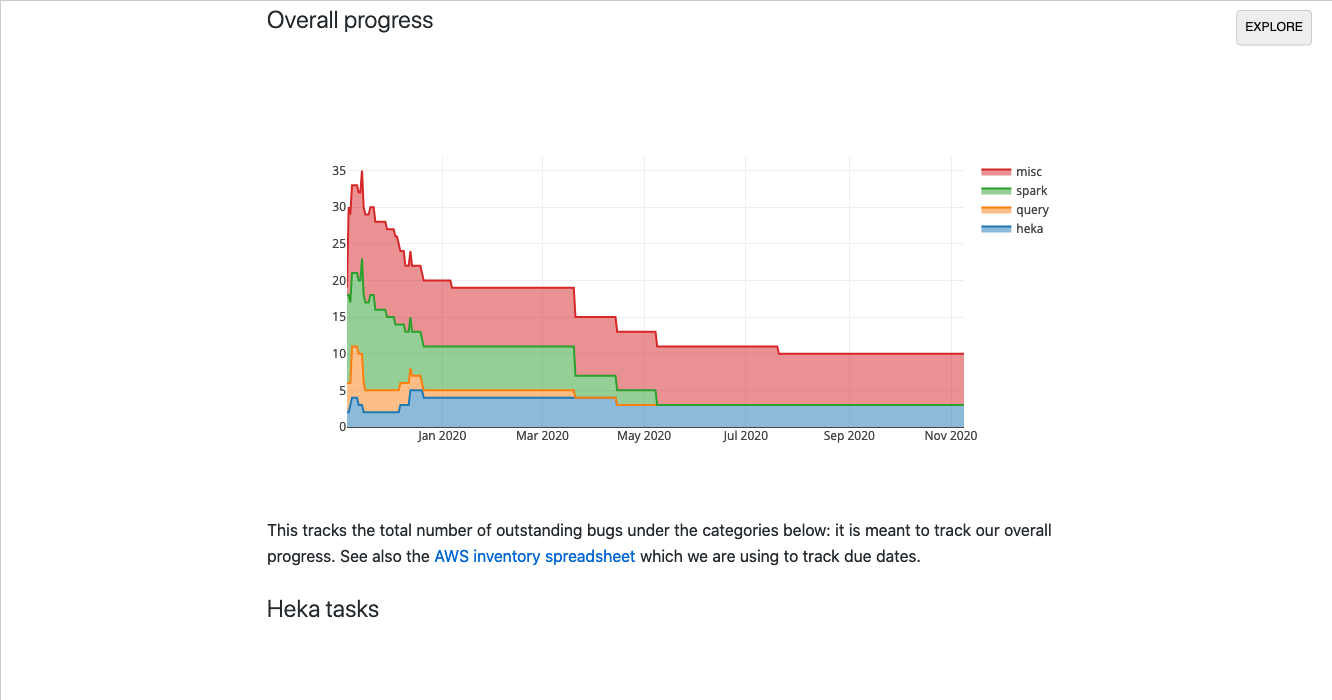
link
I built this dashboard in a single day to track our progress (resolved/open bugs) when we were migrating our data platform from AWS to GCP. It was useful: it let us quickly visualize which areas needed more attention and gave upper management more confidence that we were moving closer to our goal. However, there was little computation going on in the client: most of the backend work was happening in our Bugzilla instance: the iodide notebook just does a little bit of post-processing to visualize the results in a useful way.
Along these lines, I still think there is a place in the world for an interactive visualization environment built on principles similar to iodide: basically a markdown editor augmented with primitives oriented around data exploration (for example, charts and data tables), with allowances to bring in any JavaScript library you might want. However, any in-depth data processing would be assumed to have mostly been run elsewhere, in advance. The editing environment could either be the browser or a code editor running on your local machine, per user preference: in either case, there would not be any really important computational state running in the browser, so things like dynamic reloading (or just closing an errant tab) should not cause the user to lose any work.
This would give you the best of both worlds: you could easily create compelling visualizations that are easy to share and remix at minimal cost (because all the work happens in the browser), but you could also use whatever existing tools work best for your initial data exploration (whether that be JavaScript or the more traditional Python data science stack). And because the new tool has a reduced scope, I think building such an environment would be a much more tractable project for an individual or small group to pursue.
More on this in the future, I hope.
Many thanks to Teon Brooks and Devin Bayly for reviewing an early draft of this post
Periodically the discussion comes up about pruning away old stored Firefox build artifacts in S3. Each build is tens of megabytes, multiply that by the number of platforms we support and the set of revisions we churn through on a daily basis, and pretty soon you’re talking about real money.
This came up recently in a discussion about removing the legacy taskcluster deployment — what do we actually lose by cutting back our archive of integration builds? The main reason to keep them around is to facilitate bisection testing with mozregression, to find out when a bug was introduced. Up to now, discussions about this have been a bit hand-wavey: we do keep logs about who’s accessing old builds, but it’s never been clear whether it was mozregression accessing them or something else.
Happily, now that mozregression has some telemetry, it’s a little easier to get some answers on what people are actually doing. This query gets the distribution of build ages (launched or bisected) over the past 6 months, at a month long granularity.1 Ages are relative to the date mozregression was launched: for example, if someone asked for a build from May 2019 in June 2020, the number would be “13”.
SELECT metrics.string.usage_app AS app,
       metrics.string.usage_build_type AS build_type,
       DATE_DIFF(DATE(submission_timestamp), IF(LENGTH(metrics.datetime.usage_bad_date) > 0, PARSE_DATE('%Y-%m-%d', substr(metrics.datetime.usage_bad_date, 1, 10)), PARSE_DATE('%Y-%m-%d', substr(metrics.datetime.usage_launch_date, 1, 10))), MONTH) + 1 AS build_age
FROM `moz-fx-data-shared-prod`.org_mozilla_mozregression.usage
WHERE DATE(submission_timestamp) >= DATE_SUB(CURRENT_DATE(), INTERVAL 6 MONTH)
  AND client_info.app_display_version NOT LIKE '%dev%'
  AND LENGTH(metrics.string.usage_build_type) > 0
  AND (LENGTH(metrics.datetime.usage_bad_date) > 0
       OR LENGTH(metrics.datetime.usage_launch_date) > 0)
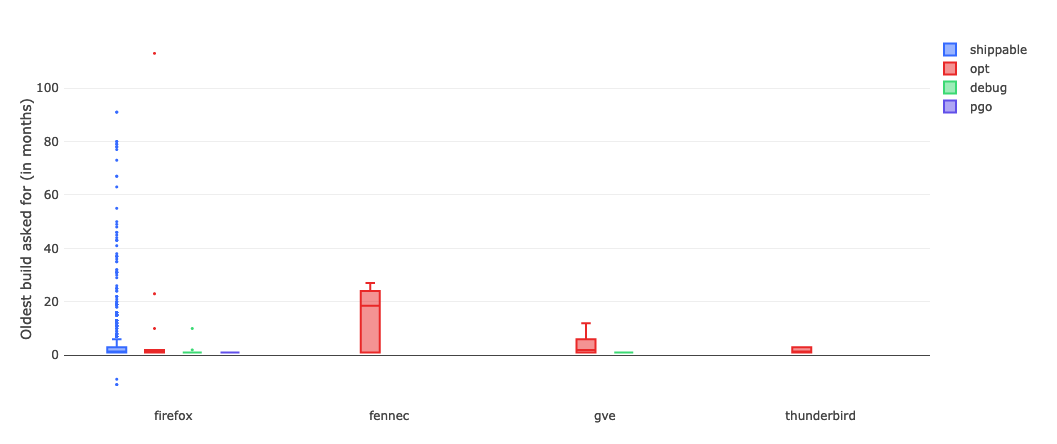
I ran this query on sql.telemetry.mozilla.org and generated a box plot, broken down by product and build type:
link (requires Mozilla LDAP)
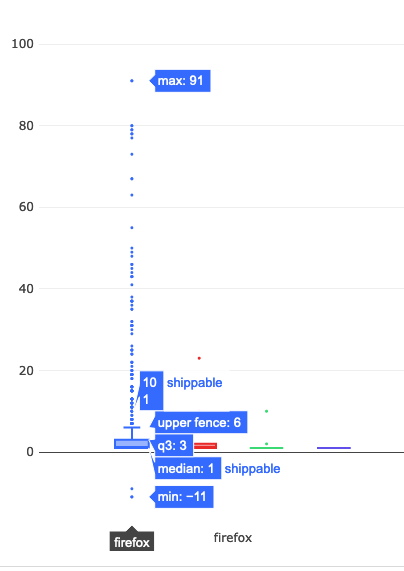
Unsurprisingly, Firefox shippable builds are the number one thing people try to bisect. Let’s take a little bit of a closer look at what’s going on there:
The median value is 1, which indicates that most people are bisecting builds within one month of the day in which mozregression was run. And the upper fence result is 6, suggesting that most of the time people are looking at a regression range that is within a 6 month range. However, looking more closely at the data points themselves (the little points in the chart above), there are a considerable number of outliers where a range greater than 20 months was asked for.
… which brings up to the question that we want to answer. Given that getting old builds isn’t that common (which we sort of knew already, based on the access patterns in the S3 logs), what is the impact of the times that we do? And it’s here where I have to throw up my hands and say “I don’t know” and suggest that we go back to empirical observation and user research.
You can go back to the thread I linked above, and see that core Firefox/Gecko developers find the ability to get a precise regression range for older revisions valuable. One thing that’s worth mentioning is that mozregression isn’t run that often, compared to a product that we ship: on the order of 50 to 100 times per a day. But when it comes to internal tooling, a small amount of use might have a big impact: if a mozregression invocation a developer a few hours (or more), that’s a real benefit to Firefox and Mozilla. The same argument might apply here, where a small number of bisections on older builds might have a disproportionate impact on the quality of the product.
(“This Week in Glean” is a series of blog posts that the Glean Team at Mozilla is using to try to communicate better about our work. They could be release notes, documentation, hopes, dreams, or whatever: so long as it is inspired by Glean. You can find an index of all TWiG posts online.)
This is a special guest post by non-Glean-team member William Lachance!
In the last year or so, there’s been a significant shift in the way we (Data Engineering) think about application-submitted data @ Mozilla, but although we have a new application-based SDK based on these principles (the Glean SDK), most of our data tools and documentation have not yet been updated to reflect this new state of affairs.
Much of this story is known inside Mozilla Data Engineering, but I thought it might be worth jotting them down into a blog post as a point of reference for people outside the immediate team. Knowing this may provide some context for some our activities and efforts over the next year or two, at least until our tools, documentation, and tribal knowledge evolve.
In sum, the key differences are:
- Instead of just one application we care about, there are many.
- Instead of just caring about (mostly1) one type of ping (the Firefox main ping), an individual application may submit many different types of pings in the course of their use.
- Instead of having both probes (histogram, scalar, or other data type) and bespoke parametric values in a JSON schema like the telemetry environment, there are now only metric types which are explicitly defined as part of each ping.
The new world is pretty exciting and freeing, but there is some new domain complexity that we need to figure out how to navigate. I’ll discuss that in my last section.
The Old World: Firefox is king
Up until roughly mid–2019, Firefox was the centre of Mozilla’s data world (with the occasional nod to Firefox for Android, which uses the same source repository). The Data Platform (often called “Telemetry”) was explicitly designed to cater to the needs of Firefox Developers (and to a lesser extent, product/program managers) and a set of bespoke tooling was built on top of our data pipeline architecture - this blog post from 2017 describes much of it.
In outline, the model is simple: on the client side, assuming a given user had not turned off Telemetry, during the course of a day’s operation Firefox would keep track of various measures, called “probes”. At the end of that duration, it would submit a JSON-encoded “main ping” to our servers with the probe information and a bunch of other mostly hand-specified junk, which would then find its way to a “data lake” (read: an Amazon S3 bucket). On top of this, we provided a python API (built on top of PySpark) which enabled people inside Mozilla to query all submitted pings across our usage population.
The only type of low-level object that was hard to keep track of was the list of probes: Firefox is a complex piece of software and there are many aspects of it we wanted to instrument to validate performance and quality of the product - especially on the more-experimental Nightly and Beta channels. To solve this problem, a probe dictionary was created to help developers find measures that corresponded to the product area that they were interested in.
On a higher-level, accessing this type of data using the python API quickly became slow and frustrating: the aggregation of years of Firefox ping data was hundreds of terabytes big, and even taking advantage of PySpark’s impressive capabilities, querying the data across any reasonably large timescale was slow and expensive. Here, the solution was to create derived datasets which enabled fast(er) access to pings and other derived measures, document them on docs.telemetry.mozilla.org, and then allow access to them through tools like sql.telemetry.mozilla.org or the Measurement Dashboard.
The New World: More of everything
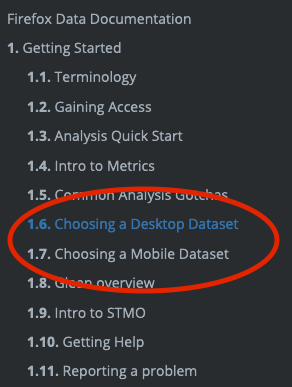
Even in the old world, other products that submitted telemetry existed (e.g. Firefox for Android, Firefox for iOS, the venerable FirefoxOS) but I would not call them first-class citizens. Most of our documentation treated them as (at best) weird edge cases. At the time of this writing, you can see this distinction clearly on docs.telemetry.mozilla.org where there is one (fairly detailed) tutorial called “Choosing a Desktop Dataset” while essentially all other products are lumped into “Choosing a Mobile Dataset”.
While the new universe of mobile products are probably the most notable addition to our list of things we want to keep track of, they’re only one piece of the puzzle. Really we’re interested in measuring all the things (in accordance with our lean data practices, of course) including tools we use to build our products like mozphab and mozregression.
In expanding our scope, we’ve found that mobile (and other products) have different requirements that influence what data we would want to send and when. For example, sending one blob of JSON multiple times per day might make sense for performance metrics on a desktop product (which is usually on a fast, unmetered network) but is much less acceptable on mobile (where every byte counts). For this reason, it makes sense to have different ping types for the same product, not just one. For example, Fenix (the new Firefox for Android) sends a tiny baseline ping2 on every run to (roughly) measure daily active users and a larger metrics ping sent on a (roughly) daily interval to measure (for example) a distribution of page load times.
Finally, we found that naively collecting certain types of data as raw histograms or inside the schema didn’t always work well. For example, encoding session lengths as plain integers would often produce weird results in the case of clock skew. For this reason, we decided to standardize on a set of well-defined metrics using Glean, which tries to minimize footguns. We explicitly no longer allow clients to submit arbitrary JSON or values as part of a telemetry ping: if you have a use case not covered by the existing metrics, make a case for it and add it to the list!
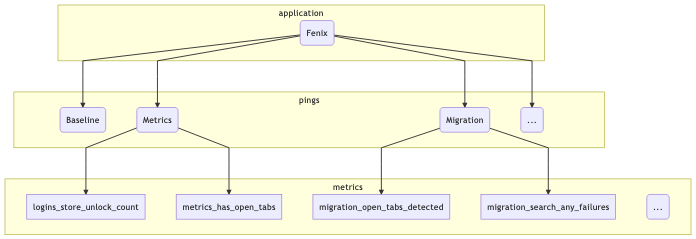
To illustrate this, let’s take a (subset) of what we might be looking at in terms of what the Fenix application sends:
mermaid source
At the top level we segment based on the “application” (just Fenix in this example). Just below that, there are the pings that this application might submit (I listed three: the baseline and metrics pings described above, along with a “migration” ping, which tracks metrics when a user migrates from Fennec to Fenix). And below that there are different types of metrics included in the pings: I listed a few that came out of a quick scan of the Fenix BigQuery tables using my prototype schema dictionary.
This is actually only the surface-level: at the time of this writing, Fenix has no fewer than 12 different ping types and many different metrics inside each of them.3 On a client level, the new Glean SDK provides easy-to-use primitives to help developers collect this type of information in a principled, privacy-preserving way: for example, data review is built into every metric type. But what about after it hits our ingestion endpoints?
Hand-crafting schemas, data ingestion pipelines, and individualized ETL scripts for such a large matrix of applications, ping types, and measurements would quickly become intractable. Instead, we (Mozilla Data Engineering) refactored our data pipeline to parse out the information from the Glean schemas and then create tables in our BigQuery datastore corresponding to what’s in them - this has proceeded as an extension to our (now somewhat misnamed) probe-scraper tool.
You can then query this data directly (see accessing glean data) or build up a derived dataset using our SQL-based ETL system, BigQuery-ETL. This part of the equation has been working fairly well, I’d say: we now have a diverse set of products producing Glean telemetry and submitting it to our servers, and the amount of manual effort required to add each application was minimal (aside from adding new capabilities to the platform as we went along).
What hasn’t quite kept pace is our tooling to make navigating and using this new collection of data tractable.
What could bring this all together?
As mentioned before, this new world is quite powerful and gives Mozilla a bunch of new capabilities but it isn’t yet well documented and we lack the tools to easily connect the dots from “I have a product question” to “I know how to write an SQL query / Spark Job to answer it” or (better yet) “this product dashboard will answer it”.
Up until now, our defacto answer has been some combination of “Use the probe dictionary / telemetry.mozilla.org” and/or “refer to docs.telemetry.mozilla.org”. I submit that we’re at the point where these approaches break down: as mentioned above, there are many more types of data we now need to care about than just “probes” (or “metrics”, in Glean-parlance). When we just cared about the main ping, we could write dataset documentation for its recommended access point (main_summary) and the raw number of derived datasets was managable. But in this new world, where we have N applications times M ping types, the number of canonical ping tables are now so many that documenting them all on docs.telemetry.mozilla.org no longer makes sense.
A few months ago, I thought that Google’s Data Catalog (billed as offering “a unified view of all your datasets”) might provide a solution, but on further examination it only solves part of the problem: it provides only a view on your BigQuery tables and it isn’t designed to provide detailed information on the domain objects we care about (products, pings, measures, and tools). You can map some of the properties from these objects onto the tables (e.g. adding a probe’s description field to the column representing it in the BigQuery table), but Data Calalog’s interface to surfacing and filtering through this information is rather slow and clumsy and requires detailed knowledge of how these higher level concepts relate to BigQuery primitives.
Instead, what I think we need is a new system which allows a data practitioner (Data Scientist, Firefox Engineer, Data Engineer, Product Manager, whoever) to visualize the relevant set of domain objects relevant to their product/feature of interest quickly then map them to specific BigQuery tables and other resources (e.g. visualizations using tools like GLAM) which allow people to quickly answer questions so we can make better products. Basically, I am thinking of some combination of:
- The existing probe dictionary (derived from existing product metadata)
- A new “application” dictionary (derived from some simple to-be-defined application metadata description)
- A new “ping” dictionary (derived from existing product metadata)
- A BigQuery schema dictionary (I wrote up a prototype of this a couple weeks ago) to map between these higher-level objects and what’s in our low-level data store
- Documentation for derived datasets generated by BigQuery-ETL (ideally stored alongside the ETL code itself, so it’s easy to keep up to date)
- A data tool dictionary describing how to easily access the above data in various ways (e.g. SQL query, dashboard plot, etc.)
This might sound ambitious, but it’s basically just a system for collecting and visualizing various types of documentation— something we have proven we know how to do. And I think a product like this could be incredibly empowering, not only for the internal audience at Mozilla but also the external audience who wants to support us but has valid concerns about what we’re collecting and why: since this system is based entirely on systems which are already open (inside GitHub or Mercurial repositories), there is no reason we can’t make it available to the public.
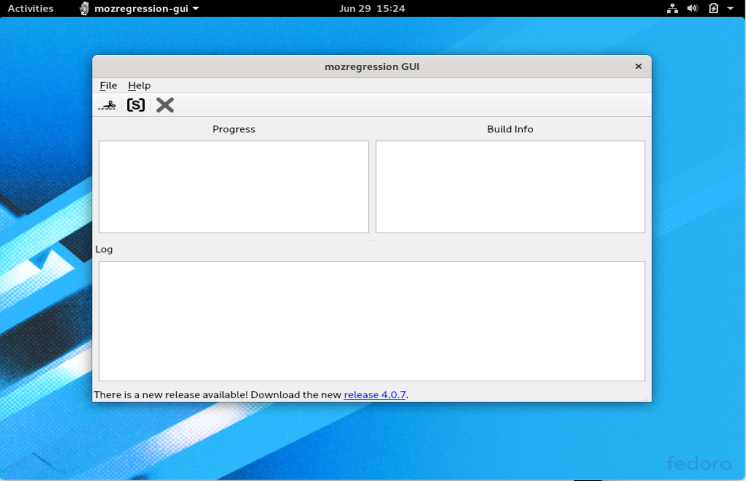
Thanks to @AnAverageHuman, mozregression once again has an easy to use and install GUI version for Linux! This used to work a few years ago, but got broken with some changes in the mozregression-python2 era and didn’t get resolved until now:
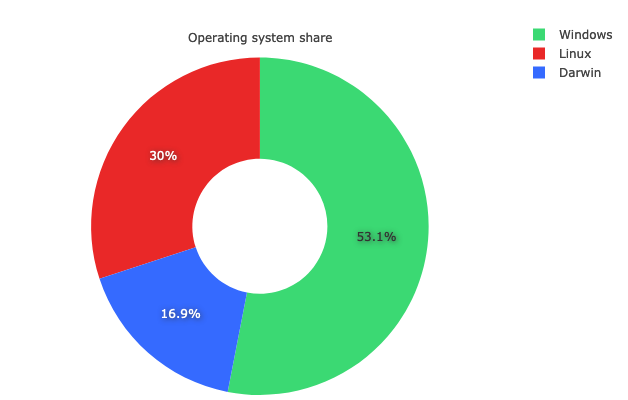
This is an area where using telemetry in mozregression can help us measure the impact of a change like this: although Windows still dominates in terms of marketshare, Linux is very widely used by contributors — of the usage of mozregression in the past 2 months, fully 30% of the sessions were on Linux (and it is possible we were undercounting that due to bug 1646402):
link to query (internal-only)
It will be interesting to watch the usage numbers for Linux evolve over the next few months. In particular, I’m curious to see what percentage of users on that platform prefer a GUI.
Appendix: reducing mozregression-GUI’s massive size
One thing that’s bothered me a bunch lately is that the mozregression GUI’s size is massive and this is even more apparent on Linux, where the initial distribution of the GUI came in at over 120 megabytes! Why so big? There were a few reasons:
- PySide2 (the GUI library we use) is very large (10s of megabytes), and PyInstaller packages all of it by default into your application distribution.
- The binary/rust portions of the Glean Python SDK were been built with debugging information included (basically as a carry-over when it was a pre-alpha product), which made it 38 megabytes big (!) on Linux.
- On Linux at least, a large number of other system libraries are packaged into the distribution.
A few aspects of this were under our control: Ian Moody (:Kwan) and myself crafted a script to manually remove unneeded PySide2 libraries as part of the packaging process. The Glean team was awesome-as-always and quickly rebuilt Glean without debugging information (this was basically an oversight). Finally, I managed to shave off a few more megabytes by reverting the Linux build to an earlier version of Ubuntu (Xenial), which is something I had been meaning to do anyway.
Even after doing all of these things, the end result is still a little underwhelming: the mozregression GUI distribution on Linux is still 79.5 megabytes big. There are probably other things we could do, but we’re definitely entering the land of diminishing returns.
Honestly, my main takeaway is just not to build an application like this in Python unless you absolutely have to (e.g. you’re building an application which needs system-level access). The web is a pretty wonderful medium for creating graphical applications these days, and by using it you sidestep these type of installation issues.
I’ve been thinking a lot about markdown, presentation, dashboards, and other frontendy sorts of things lately, partly inspired by my work on Iodide last year, partly inspired by my recent efforts on improving docs.telemetry.mozilla.org. I haven’t fully fleshed out my thoughts on this yet, but in general I think blogs (for some value of “blog”) are still a great way to communicate ideas and concepts to an interested audience.
Like many organizations, Mozilla’s gone down the path of Google Docs, Zoom and Slack which makes me more than a little sad: good ideas disappear down the memory hole super quickly with these tools, not to mention the fact that they are closed-by-default (even to people inside Mozilla!). My view on “open” is a bit more nuanced than it used to be: I no longer think everything need be all-public, all-the-time— but I still think talking about and through our ideas (even if imperfectly formed or stated) with a broad audience builds trust and leads to better outcomes.
Is there some way we can blend some of these old school ideas (blogs, newsgroups, open discussion forums) with better technology and social practices? Let’s find out.
(this post is aimed primarily at an internal audience, but I thought I’d go ahead and make it public as a blog post)
I’ve been thinking a bunch over the past few months about the Mozilla data organization’s documentation story. We have a first class data platform here at Mozilla, but using it to answer questions, especially for newer employees, can be quite intimidating. As we continue our collective journey to becoming a modern data-driven organization, part of the formula for unlocking this promise is making the tools and platforms we create accessible to a broad internal audience.
My data peers are a friendly group of people and we have historically been good at answering questions on forums like the #fx-metrics slack channel: we’ll keep doing this. That said, our time is limited: we need a common resource for helping bring people up to speed on how to use the data platform to answer common questions.
Our documentation site, docs.telemetry.mozilla.org, was meant to be this resource: however in the last couple of years an understanding of its purpose has been (at least partially) lost and it has become somewhat overgrown with content that isn’t very relevant to those it’s intended to help.
This post’s goal is to re-establish a mission for our documentation site — towards the end, some concrete proposals on what to change are also outlined.
Setting the audience
docs.telemetry.mozilla.org was and is meant to be a resource useful for data practitioners within Mozilla.
Examples of different data practioners and their use cases:
- A data scientist performing an experiment analysis
- A data analyst producing a report on the effectiveness of a recent marketing campaign
- A Firefox engineer trying to understand the performance characteristics of a new feature
- A technical product manager trying to understand the characteristics of a particular user segment
- A quality assurance engineer trying to understand the severity of a Firefox crash
There are a range of skills that these different groups bring to the table, but there are some common things we expect a data practitioner to have, whatever their formal job description:
- At least some programming and analytical experience
- Comfortable working with and understanding complex data systems with multiple levels of abstraction (for example: the relationship between the Firefox browser which produces Telemetry data and the backend system which processes it)
- The time necessary to dig into details
This also excludes a few groups:
- Senior leadership or executives: they are of course free to use docs.telemetry.mozilla.org if helpful, but it is expected that the type of analytical work covered by the documentation will normally be done by a data practitioner and that relevant concepts and background information will be explained to them (in the form of high-level dashboards, presentations, etc.).
- Data Engineering: some of the material on docs.telemetry.mozilla.org may be incidentally useful to this internal audience, but explaining the full details of the data platform itself belongs elsewhere.
What do these users need?
In general, a data practitioner is trying to answer a specific set of questions in the context of an exploration. There are a few things that they need:
- A working knowledge of how to use the technological tools to answer the questions they might have: for example, how to create a SQL query counting the median value of a particular histogram for a particular usage segment.
- A set of guidelines on best practices on how to measure specific things: for example, we want our people using our telemetry systems to use well-formulated practices for measuring things like “Monthly Active Users” rather than re-inventing such things themselves.
What serves this need?
A few years ago, Ryan Harter did an extensive literature review on writing documentation on technical subjects - the take away from this exploration is that the global consensus is that we should focus most of our attention on writing practical tutorials which enables our users to perform specific tasks in the service of the above objective.
There is a proverb, allegedly attributed to Confucius which goes something like this:
“I hear and I forget. I see and I remember. I do and I understand.”
The understanding we want to build is how to use our data systems and tools to answer questions. Some knowledge of how our data platform works is no doubt necessary to accomplish this, but it is mostly functional knowledge we care about imparting to data practitioners: the best way to build this understanding is to guide users in performing tasks.
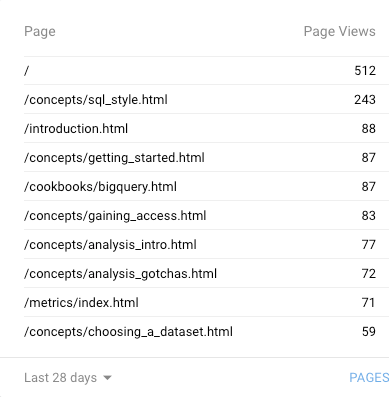
This makes sense intuitively, but it is also borne out by the data that this is what our users are looking for. Looking through the top pages on Google Analytics, virtually all of them1 refer either to a cookbook or howto guide:
Happily, this allows us to significantly narrow our focus for docs.telemetry.mozilla.org. We no longer need to worry about:
- Providing lists or summaries of data tools available inside Mozilla2: we can talk about tools only as needed in the context of tasks they want to accomplish. We may want to keep such a list handy elsewhere for some other reason (e.g. internal auditing purposes), but we can safely say that it belongs somewhere else, like the Mozilla wiki, mana, or the telemetry.mozilla.org portal.
- Detailed reference on the technical details of the data platform implementation. Links to this kind of material can be surfaced inside the documentation where relevant, but it is expected that an implementation reference will normally be stored and presented within the context of the tools themselves (a good example would be the existing documentation for GCP ingestion).
- Detailed reference on all data sets, ping types, or probes: hand-written documentation for this kind of information is difficult to keep up to date with manual processes3 and is best generated automatically and browsed with tools like the probe dictionary.
- Detailed reference material on how to submit Telemetry. While an overview of how to think about submitting telemetry may be in scope (recall that we consider Firefox engineers a kind of data practitioner), the details are really a seperate topic that is better left to another resource which is closer to the implementation (for example, the Firefox Source Documentation or the Glean SDK reference).
Scanning through the above, you’ll see a common theme: avoid overly detailed reference material. The above is not to say that we should avoid background documentation altogether. For example, an understanding of how our data pipeline works is key to understanding how up-to-date a dashboard is expected to be. However, this type of documentation should be written bearing in mind the audience (focusing on what they need to know as data practitioners) and should be surfaced towards the end of the documentation as supporting material.
As an exception, there is also a very small amount of reference documentation which we want to put at top-level because it is so important: for example the standard metrics page describes how we define “MAU” and “DAU”: these are measures that we want to standardize in the organization, and not have someone re-invent every time they produce an analysis or report. However, we should be very cautious about how much of this “front facing” material we include: if we overwhelm our audience with details right out of the gate, they are apt to ignore them.
Concrete actions
- We should continue working on tutorials on how to perform common tasks: this includes not only the low-level guides that we currently have (e.g. BigQuery and SQL tutorials) but also information on how to effectively use our higher-level, more accessible tools like GLAM and GUD to answer questions.
- Medium term, we should remove the per-dataset documentation and replace it with a graphical tool for browsing this type of information (perhaps Google Data Catalog). Since this is likely to be a rather involved project, we can keep the existing documentation for now — but for new datasets, we should encourage their authors to write tutorials on how to use them effectively (assuming they are of broad general interest) instead of hand-creating schema definitions that are likely to go out of date quickly.
- We should set clear expectations and guidelines of what does and doesn’t belong on docs.telemetry.mozilla.org as part of a larger style guide. This style guide should be referenced somewhere prominent (perhaps as part of a pull request template) so that historical knowledge of what this resource is for isn’t lost.
(“This Week in Glean” is a series of blog posts that the Glean Team at Mozilla is using to try to communicate better about our work. They could be release notes, documentation, hopes, dreams, or whatever: so long as it is inspired by Glean. You can find an index of all TWiG posts online.)
This is a special guest post by non-Glean-team member William Lachance!
This is a continuation of an exploration of adding Glean-based telemetry to a python application, in this case mozregression, a tool for automatically finding the source of Firefox regressions (breakage).
When we left off last time, we had written some test scripts and verified that the data was visible in the debug viewer.
Adding Telemetry to mozregression itself
In many ways, this is pretty similar to what I did inside the sample application: the only significant difference is that these are shipped inside a Python application that is meant to be be installable via pip. This means we need to specify the pings.yaml and metrics.yaml (located inside the mozregression subirectory) as package data inside setup.py:
setup(
    name="mozregression",
    ...
    package_data={"mozregression": ["*.yaml"]},
    ...
)
There were also a number of Glean SDK enhancements which we determined were necessary. Most notably, Michael Droettboom added 32-bit Windows wheels to the Glean SDK, which we need to make building the mozregression GUI on Windows possible. In addition, some minor changes needed to be made to Glean’s behaviour for it to work correctly with a command-line tool like mozregression — for example, Glean used to assume that Telemetry would always be disabled via a GUI action so that it would send a deletion ping, but this would obviously not work in an application like mozregression where there is only a configuration file — so for this case, Glean needed to be modified to check if it had been disabled between runs.
Many thanks to Mike (and others on the Glean team) for so patiently listening to my concerns and modifying Glean accordingly.
Getting Data Review
At Mozilla, we don’t just allow random engineers like myself to start collecting data in a product that we ship (even a semi-internal like mozregression). We have a process, overseen by Data Stewards to make sure the information we gather is actually answering important questions and doesn’t unnecessarily collect personally identifiable information (e.g. email addresses).
You can see the specifics of how this worked out in the case of mozregression in bug 1581647.
Documentation
Glean has some fantastic utilities for generating markdown-based documentation on what information is being collected, which I have made available on GitHub:
https://github.com/mozilla/mozregression/blob/master/docs/glean/metrics.md
The generation of this documentation is hooked up to mozregression’s continuous integration, so we can sure it’s up to date.
I also added a quick note to mozregression’s web site describing the feature, along with (very importantly) instructions on how to turn it off.
Enabling Data Ingestion
Once a Glean-based project has passed data review, getting our infrastructure to ingest it is pretty straightforward. Normally we would suggest just filing a bug and let us (the data team) handle the details, but since I’m on that team, I’m going to go a (little bit) of detail into how the sausage is made.
Behind the scenes, we have a collection of ETL (extract-transform-load) scripts in the probe-scraper repository which are responsible for parsing the ping and probe metadata files that I added to mozregression in the step above and then automatically creating BigQuery tables and updating our ingestion machinery to insert data passed to us there.
There’s quite a bit of complicated machinery being the scenes to make this all work, but since it’s already in place, adding a new thing like this is relatively simple. The changeset I submitted as part of a pull request to probe-scraper was all of 9 lines long:
diff --git a/repositories.yaml b/repositories.yaml
index dffcccf..6212e55 100644
--- a/repositories.yaml
+++ b/repositories.yaml
@@ -239,3 +239,12 @@ firefox-android-release:
     - org.mozilla.components:browser-engine-gecko-beta
     - org.mozilla.appservices:logins
     - org.mozilla.components:support-migration
+mozregression:
+  app_id: org-mozilla-mozregression
+  notification_emails:
+    - wlachance@mozilla.com
+  url: 'https://github.com/mozilla/mozregression'
+  metrics_files:
+    - 'mozregression/metrics.yaml'
+  ping_files:
+    - 'mozregression/pings.yaml'
A Pretty Graph
With the probe scraper change merged and deployed, we can now start querying! A number of tables are automatically created according to the schema outlined above: notably “live” and “stable” tables corresponding to the usage ping. Using sql.telemetry.mozilla.org we can start exploring what’s out there. Here’s a quick query I wrote up:
SELECT DATE(submission_timestamp) AS date,
       metrics.string.usage_variant AS variant,
       count(*),
FROM `moz-fx-data-shared-prod`.org_mozilla_mozregression_stable.usage_v1
WHERE DATE(submission_timestamp) >= '2020-04-14'
  AND client_info.app_display_version NOT LIKE '%.dev%'
GROUP BY date, variant;
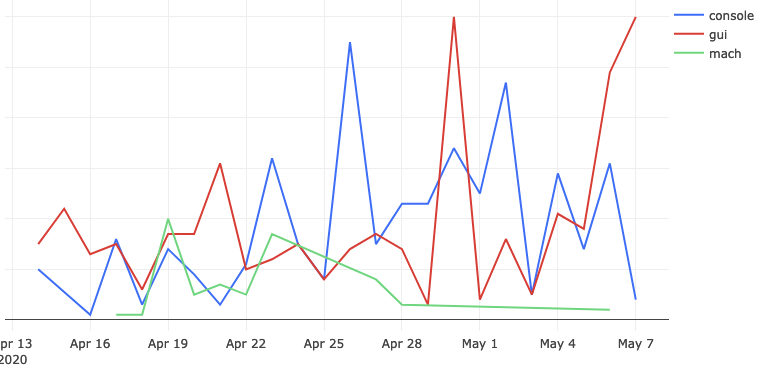
… which generates a chart like this:
This chart represents the absolute volume of mozregression usage since April 14th 2020 (around the time when we first released a version of mozregression with Glean telemetry), grouped by mozregression “variant” (GUI, console, and mach) and date - you can see that (unsurprisingly?) the GUI has the highest usage. I’ll talk about this more in an upcoming installment, speaking of…
Next Steps
We’re not done yet! Next time, we’ll look into making a public-facing dashboard demonstrating these results and making an aggregated version of the mozregression telemetry data publicly accessible to researchers and the general public. If we’re lucky, there might even be a bit of data science. Stay tuned!