iodide retrospective
Nov 10th, 2020
A bit belatedly, I thought I’d write a short retrospective on Iodide: an effort to create a compelling, client-centred scientific notebook environment.
Despite not writing a ton about it (the sole exception being this brief essay about my conservative choice for the server backend) Iodide took up a very large chunk of my mental energy from late 2018 through 2019. It was also essentially my only attempt at working on something that was on its way to being an actual product while at Mozilla: while I’ve led other projects that have been interesting and/or impactful in my 9 odd-years here (mozregression and perfherder being the biggest successes), they fall firmly into the “internal tools supporting another product” category.
At this point it’s probably safe to say that the project has wound down: no one is being paid to work on Iodide and it’s essentially in extreme maintenance mode. Before it’s put to bed altogether, I’d like to write a few notes about its approach, where I think it had big advantanges, and where it seems to fall short. I’ll conclude with some areas I’d like to explore (or would like to see others explore!). I’d like to emphasize that this is my opinion only: the rest of the Iodide core team no doubt have their own thoughts. That said, let’s jump in.
What is Iodide, anyway?
One thing that’s interesting about a product like Iodide is that people tend to project their hopes and dreams onto it: if you asked any given member of the Iodide team to give a 200 word description of the project, you’d probably get a slightly different answer emphasizing different things. That said, a fair initial approximation of the project vision would be “a scientific notebook like Jupyter, but running in the browser”.
What does this mean? First, let’s talk about what Jupyter does: at heart, it’s basically a Python “kernel” (read: interpreter), fronted by a webserver. You send snipits of the code to the interpreter via a web interface and they would faithfully be run on the backend (either on your local machine in a separate process or a server in the cloud). Results are then be returned back to the web interface and then rendered by the browser in one form or another.
Iodide’s model is quite similar, with one difference: instead of running the kernel in another process or somewhere in the cloud, all the heavy lifting happens in the browser itself, using the local JavaScript and/or WebAssembly runtime. The very first version of the product that Hamilton Ulmer and Brendan Colloran came up with was definitely in this category: it had no server-side component whatsoever.
Truth be told, even applications like Jupyter do a fair amount of computation on the client side to render a user interface and the results of computations: the distinction is not as clear cut as you might think. But in general I think the premise holds: if you load an iodide notebook today (still possible on alpha.iodide.io! no account required), the only thing that comes from the server is a little bit of static JavaScript and a flat file delivered as a JSON payload. All the “magic” of whatever computation you might come up with happens on the client.
Let’s take a quick look at the default tryit iodide notebook to give an idea of what I mean:
%% fetch
// load a js library and a csv file with a fetch cell
js: https://cdnjs.cloudflare.com/ajax/libs/d3/4.10.2/d3.js
text: csvDataString = https://data.sfgov.org/api/views/5cei-gny5/rows.csv?accessType=DOWNLOAD

%% js
// parse the data using the d3 library (and show the value in the console)
parsedData = d3.csvParse(csvDataString)

%% js
// replace the text in the report element "htmlInMd"
document.getElementById('htmlInMd').innerText = parsedData[0].Address

%% py
# use python to select some of the data
from js import parsedData
[x['Address'] for x in parsedData if x['Lead Remediation'] == 'true']
The %% delimiters indicate individual cells. The fetch cell is an iodide-native cell with its own logic to load the specified resources into a JavaScript variables when evaluated. js and py cells direct the browser to interpret the code inside of them, which causes the DOM to mutate. From these building blocks (and a few others), you can build up an interactive report which can also be freely forked and edited by anyone who cares to.
In some ways, I think Iodide has more in common with services like Glitch or Codepen than with Jupyter. In effect, it’s mostly offering a way to build up a static web page (doing whatever) using web technologies— even if the user interface affordances and cell-based computation model might remind you more of a scientific notebook.
What works well about this approach
There’s a few nifty things that come from doing things this way:
- The environment is easily extensible for those familiar with JavaScript or other client side technologies. There is no need to mess with strange plugin architectures or APIs or conform to the opinions of someone else on what options there are for data visualization and presentation. If you want to use jQuery inside your notebook for a user interface widget, just import it and go!
- The architecture scales to many, many users: since all the computation happens on the client, the server’s only role is to store and retrieve notebook content. alpha.iodide.io has happily been running on Heroku’s least expensive dyno type for its entire existence.
- Reproducibility: so long as the iodide notebook has no references to data on third party servers with authentiction, there is no stopping someone from being able to reproduce whatever computations led to your results.
- Related to reproducibility, it’s easy to build off of someone else’s notebook or exploration, since everything is so self-contained.
I continue to be surprised and impressed with what people come up with in the Jupyter ecosystem so I don’t want to claim these are things that “only Iodide” (or other tools like it) can do— what I will say is that I haven’t seen many things that combine both the conciseness and expressiveness of iomd. The beauty of the web is that there is such an abundance of tutorials and resources to support creating interactive content: when building iodide notebooks, I would freely borrow from resources such as MDN and Stackoverflow, instead of being locked into what the authoring software thinks one should be able express.
What’s awkward
Every silver lining has a cloud and (unfortunately) Iodide has a pretty big one. Depending on how you use Iodide, you will almost certainly run into the following problems:
- You are limited by the computational affordances provided by the browser: there is no obvious way to offload long-running or expensive computations to a cluster of machines using a technology like Spark.
- Long-running computations will block the main thread, causing your notebook to become extremely unresponsive for the duration.
The first, I (and most people?) can usually live with. Computers are quite powerful these days and most data tasks I’m interested in are easily within the range of capabilities of my laptop. In the cases where I need to do something larger scale, I’m quite happy to fire up a Jupyter Notebook, BigQuery Console, or <other tool of choice> to do the heavy-lifting, and then move back to a client-side approach to visualize and explore my results.
The second is much harder to deal with, since it means that the process of exploration that is so key to scientific computing. I’m quite happy to wait 5 seconds, 15 seconds, even a minute for a longer-running computation to complete but if I see the slow script dialog and everything about my environment grinds to a halt, it not only blocks my work but causes me to lose faith in the system. How do I know if it’s even going to finish?
This occurs way more often than you might think: even a simple notebook loading pandas (via pyodide) can cause Firefox to pop up the slow script dialog:
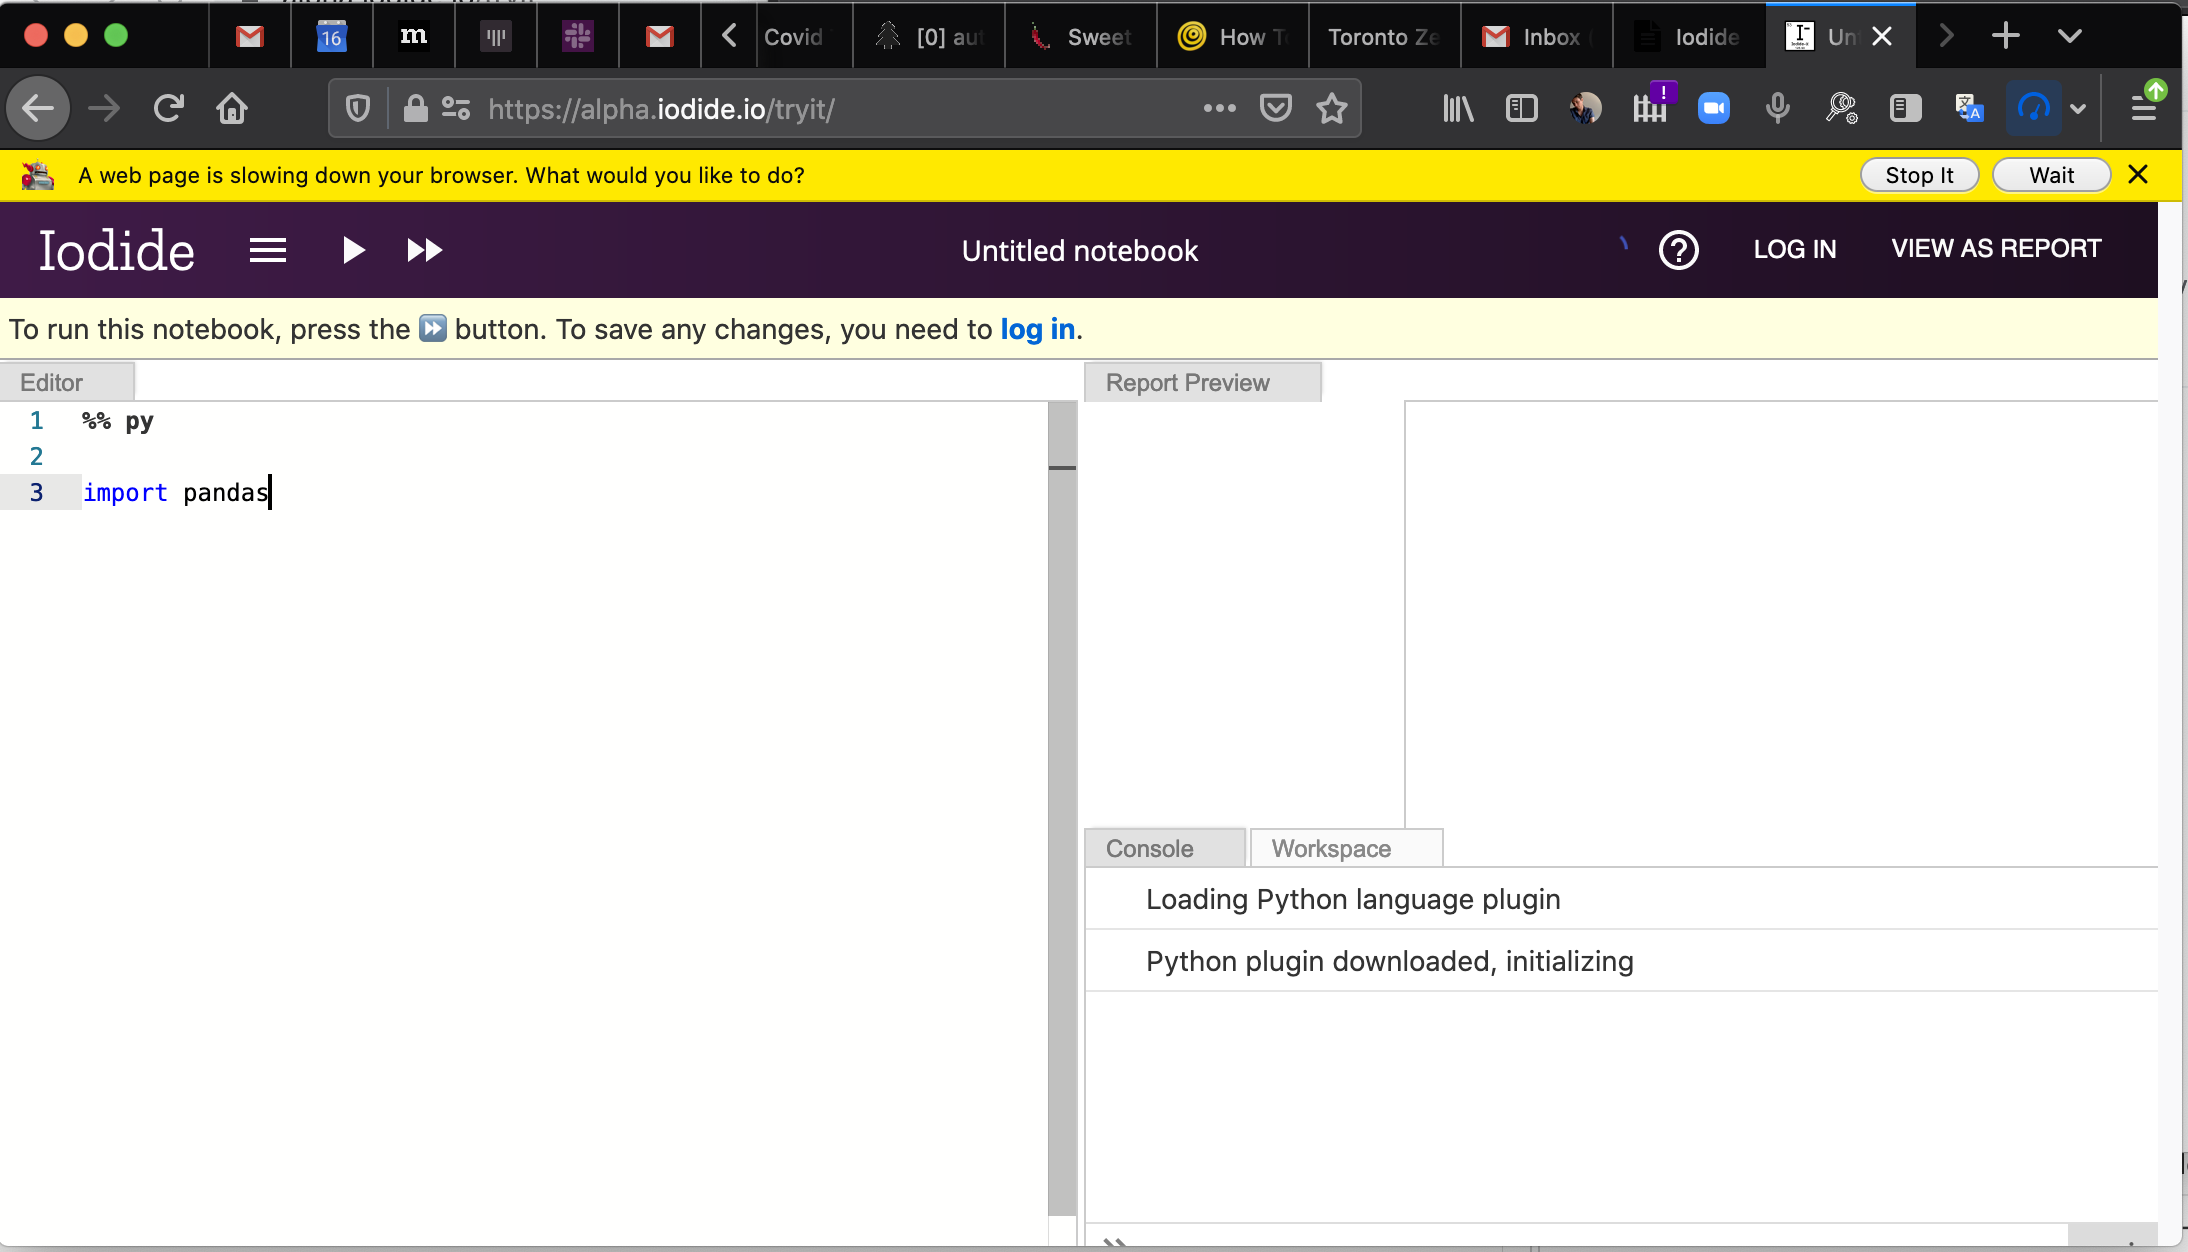
Why is this so? Aren’t browsers complex beasts which can do a million things in parallel these days? Only sort of: while the graphical and network portions of loading and using a web site are highly parallel, JavaScript and any changes to the DOM can only occur synchronously by default. Let’s break down a simple iodide example which trivially hangs the browser:
%% js

while (1) { true }
link (but you really don’t want to)
What’s going on here? When you execute that cell, the web site’s sole thread is now devoted to running that infinite loop. No longer can any other JavaScript-based event handler be run, so for example the text editor (which uses Monaco under the hood) and menus are now completely unresponsive.
The iodide team was aware of this issue since I joined the project. There were no end of discussions about how to work around it, but they never really come to a satisfying conclusion. The most obvious solution is to move the cell’s computation to a web worker, but workers don’t have synchronous access to the DOM which is required for web content to work as you’d expect. While there are projects like ComLink that attempt to bridge this divide, they require both a fair amount of skill and code to use effectively. As mentioned above, one of the key differentiators between iodide and other notebook environments is that tools like jQuery, d3, etc. “just work”. That is, you can take a code snipit off the web and run it inside an iodide notebook: there’s no workaround I’ve been able to find which maintains that behaviour and ensures that the Iodide notebook environment is always responsive.
It took a while for this to really hit home, but having some separation from the project, I’ve come to realize that the problem is that the underlying technology isn’t designed for the task we were asking of it, nor is it likely to ever be in the near future. While the web (by which I mean not only the browser, but the ecosystem of popular tooling and libraries that has been built on top of it) has certainly grown in scope to things it was never envisioned to handle like games and office applications, it’s just not optimized for what I’d call “editable content”. That is, the situation where a web page offers affordances for manipulating its own representation.
While modern web browsers have evolved to (sort of) protect one errant site from bringing the whole thing down, they certainly haven’t evolved to protect a particular site against itself. And why would they? Web developers usually work in the terminal and text editor: the assumption is that if their test code misbehaves, they’ll just kill their tab and start all over again. Application state is persisted either on-disk or inside an external database, so nothing will really be lost.
Could this ever change? Possibly, but I think it would be a radical rethinking of what the web is, and I’m not really sure what would motivate it.
A way forward
While working on iodide, we were fond of looking at this diagram, which was taken from this study of the data science workflow:
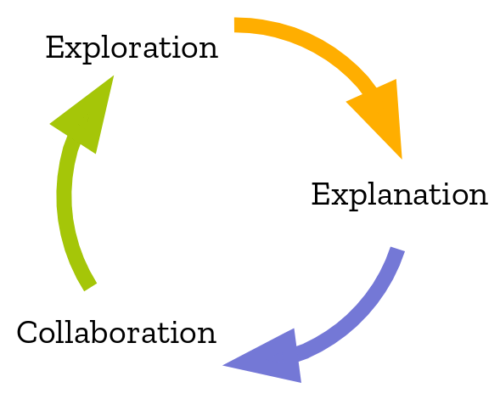
It describes how people typically perform computational inquiry: typically you would poke around with some raw data, run some transformations on it. Only after that process was complete would you start trying to build up a “presentation” of your results to your audience.
Looking back, it’s clear that Iodide’s strong suit was the explanation part of this workflow, rather than collaboration and exploration. My strong suspicion is that we actually want to use different tools for each one of these tasks. Coincidentally, this also maps to the bulk of my experience working with data at Mozilla, using iodide or not: my most successful front-end data visualization projects were typically the distilled result of a very large number of adhoc explorations (python scripts, SQL queries, Jupyter notebooks, …). The actual visualization itself contains very little computational meat: basically “just enough” to let the user engage with the data fruitfully.
Unfortunately much of my work in this area uses semi-sensitive internal Mozilla data so can’t be publicly shared, but here’s one example:
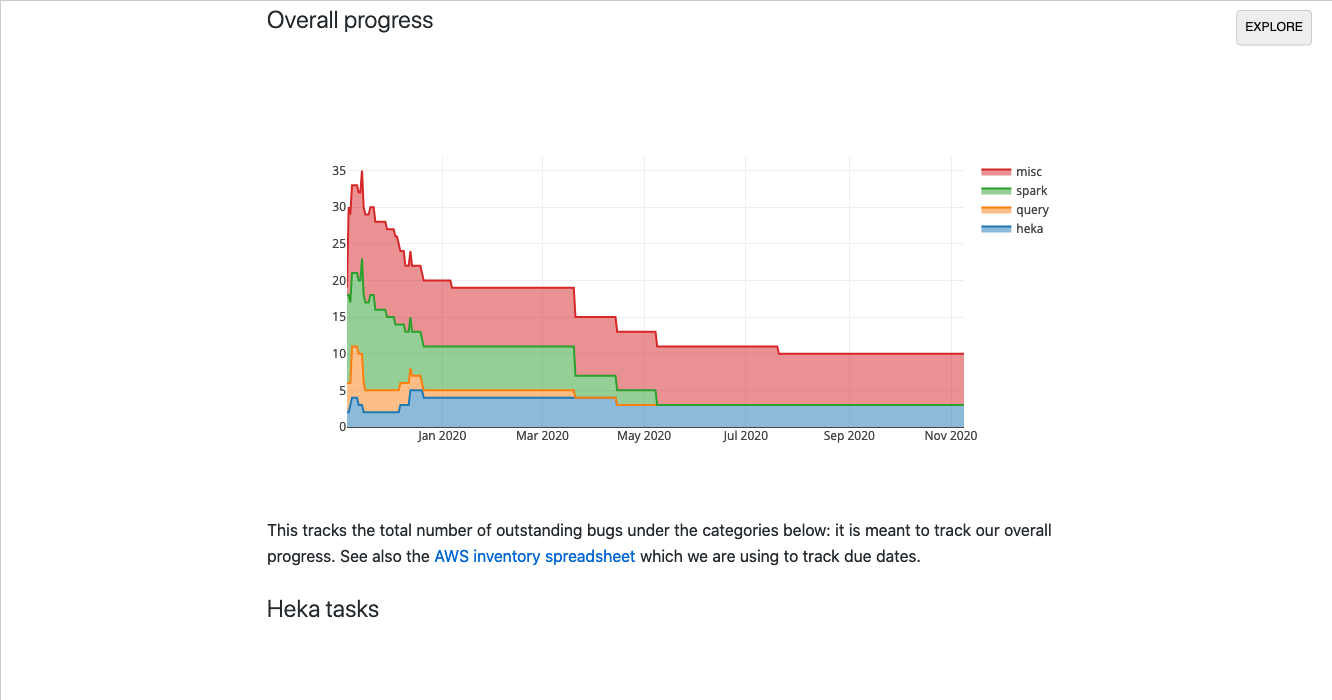
I built this dashboard in a single day to track our progress (resolved/open bugs) when we were migrating our data platform from AWS to GCP. It was useful: it let us quickly visualize which areas needed more attention and gave upper management more confidence that we were moving closer to our goal. However, there was little computation going on in the client: most of the backend work was happening in our Bugzilla instance: the iodide notebook just does a little bit of post-processing to visualize the results in a useful way.
Along these lines, I still think there is a place in the world for an interactive visualization environment built on principles similar to iodide: basically a markdown editor augmented with primitives oriented around data exploration (for example, charts and data tables), with allowances to bring in any JavaScript library you might want. However, any in-depth data processing would be assumed to have mostly been run elsewhere, in advance. The editing environment could either be the browser or a code editor running on your local machine, per user preference: in either case, there would not be any really important computational state running in the browser, so things like dynamic reloading (or just closing an errant tab) should not cause the user to lose any work.
This would give you the best of both worlds: you could easily create compelling visualizations that are easy to share and remix at minimal cost (because all the work happens in the browser), but you could also use whatever existing tools work best for your initial data exploration (whether that be JavaScript or the more traditional Python data science stack). And because the new tool has a reduced scope, I think building such an environment would be a much more tractable project for an individual or small group to pursue.
More on this in the future, I hope.
Many thanks to Teon Brooks and Devin Bayly for reviewing an early draft of this post