Perfherder update
Jul 14th, 2015
Haven’t been doing enough blogging about Perfherder (our project to make Talos and other per-checkin performance data more useful) recently. Let’s fix that. We’ve been making some good progress, helped in part by a group of new contributors that joined us through an experimental "summer of contribution" program.
Comparison mode
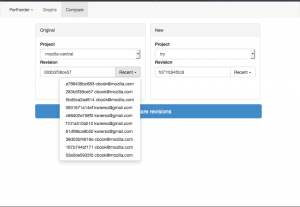
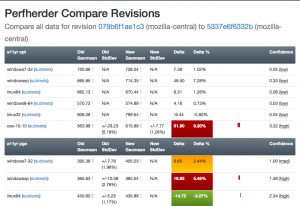
Inspired by Compare Talos, we’ve designed something similar which hooks into the perfherder backend. This has already gotten some interest: see this post on dev.tree-management and this one on dev.platform. We’re working towards building something that will be really useful both for (1) illustrating that the performance regressions we detect are real and (2) helping developers figure out the impact of their changes before they land them.
 |
 |
Most of the initial work was done by Joel Maher with lots of review for aesthetics and correctness by me. Avi Halmachi from the Performance Team also helped out with the t-test model for detecting the confidence that we have that a difference in performance was real. Lately myself and Mike Ling (one of our summer of contribution members) have been working on further improving the interface for usability — I’m hopeful that we’ll soon have something implemented that’s broadly usable and comprehensible to the Mozilla Firefox and Platform developer community.
Graphs improvements
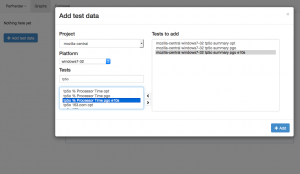
Although it’s received slightly less attention lately than the comparison view above, we’ve been making steady progress on the graphs view of performance series. Aside from demonstrations and presentations, the primary use case for this is being able to detect visually sustained changes in the result distribution for talos tests, which is often necessary to be able to confirm regressions. Notable recent changes include a much easier way of selecting tests to add to the graph from Mike Ling and more readable/parseable urls from Akhilesh Pillai (another summer of contribution participant).
Performance alerts
I’ve also been steadily working on making Perfherder generate alerts when there is a significant discontinuity in the performance numbers, similar to what GraphServer does now. Currently we have an option to generate a static CSV file of these alerts, but the eventual plan is to insert these things into a peristent database. After that’s done, we can actually work on creating a UI inside Perfherder to replace alertmanager (which currently uses GraphServer data) and start using this thing to sheriff performance regressions — putting the herder into perfherder.
As part of this, I’ve converted the graphserver alert generation code into a standalone python library, which has already proven useful as a component in the Raptor project for FirefoxOS. Yay modularity and reusability.
Python API
I’ve also been working on creating and improving a python API to access Treeherder data, which includes Perfherder. This lets you do interesting things, like dynamically run various types of statistical analysis on the data stored in the production instance of Perfherder (no need to ask me for a database dump or other credentials). I’ve been using this to perform validation of the data we’re storing and debug various tricky problems. For example, I found out last week that we were storing up to duplicate 200 entries in each performance series due to double data ingestion — oops.
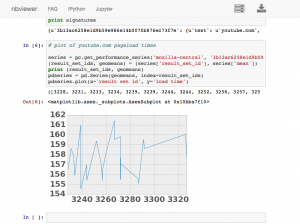
You can also use this API to dynamically create interesting graphs and visualizations using ipython notebook, here’s a simple example of me plotting the last 7 days of youtube.com pageload data inline in a notebook:
[original]

