Showing posts tagged FirefoxOS
Haven’t been doing enough blogging about Perfherder (our project to make Talos and other per-checkin performance data more useful) recently. Let’s fix that. We’ve been making some good progress, helped in part by a group of new contributors that joined us through an experimental "summer of contribution" program.
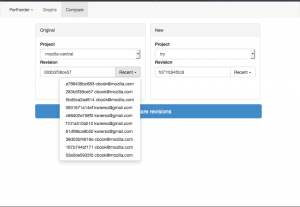
Comparison mode
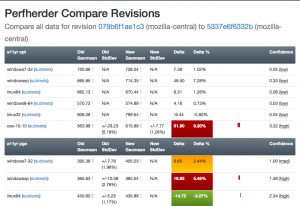
Inspired by Compare Talos, we’ve designed something similar which hooks into the perfherder backend. This has already gotten some interest: see this post on dev.tree-management and this one on dev.platform. We’re working towards building something that will be really useful both for (1) illustrating that the performance regressions we detect are real and (2) helping developers figure out the impact of their changes before they land them.
 |
 |
Most of the initial work was done by Joel Maher with lots of review for aesthetics and correctness by me. Avi Halmachi from the Performance Team also helped out with the t-test model for detecting the confidence that we have that a difference in performance was real. Lately myself and Mike Ling (one of our summer of contribution members) have been working on further improving the interface for usability — I’m hopeful that we’ll soon have something implemented that’s broadly usable and comprehensible to the Mozilla Firefox and Platform developer community.
Graphs improvements
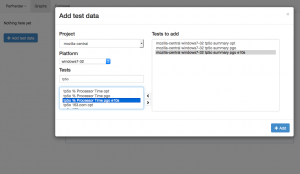
Although it’s received slightly less attention lately than the comparison view above, we’ve been making steady progress on the graphs view of performance series. Aside from demonstrations and presentations, the primary use case for this is being able to detect visually sustained changes in the result distribution for talos tests, which is often necessary to be able to confirm regressions. Notable recent changes include a much easier way of selecting tests to add to the graph from Mike Ling and more readable/parseable urls from Akhilesh Pillai (another summer of contribution participant).

Performance alerts
I’ve also been steadily working on making Perfherder generate alerts when there is a significant discontinuity in the performance numbers, similar to what GraphServer does now. Currently we have an option to generate a static CSV file of these alerts, but the eventual plan is to insert these things into a peristent database. After that’s done, we can actually work on creating a UI inside Perfherder to replace alertmanager (which currently uses GraphServer data) and start using this thing to sheriff performance regressions — putting the herder into perfherder.
As part of this, I’ve converted the graphserver alert generation code into a standalone python library, which has already proven useful as a component in the Raptor project for FirefoxOS. Yay modularity and reusability.
Python API
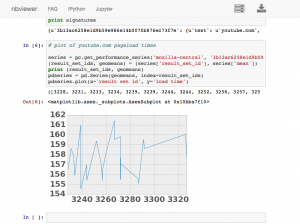
I’ve also been working on creating and improving a python API to access Treeherder data, which includes Perfherder. This lets you do interesting things, like dynamically run various types of statistical analysis on the data stored in the production instance of Perfherder (no need to ask me for a database dump or other credentials). I’ve been using this to perform validation of the data we’re storing and debug various tricky problems. For example, I found out last week that we were storing up to duplicate 200 entries in each performance series due to double data ingestion — oops.
You can also use this API to dynamically create interesting graphs and visualizations using ipython notebook, here’s a simple example of me plotting the last 7 days of youtube.com pageload data inline in a notebook:

[original]
I had some time on my hands two weekends ago and was feeling a bit of an itch to build something, so I decided to do a project I’ve had in the back of my head for a while: a meditation timer.
If you’ve been following this log, you’d know that meditation has been a pretty major interest of mine for the past year. The foundation of my practice is a daily round of seated meditation at home, where I have been attempting to follow the breath and generally try to connect with the world for a set period every day (usually varying between 10 and 30 minutes, depending on how much of a rush I’m in).
Clock watching is rather distracting while sitting so having a tool to notify you when a certain amount of time has elapsed is quite useful. Writing a smartphone app to do this is an obvious idea, and indeed approximately a zillion of these things have been written for Android and iOS. Unfortunately, most are not very good. Really, I just want something that does this:
- Select a meditation length (somewhere between 10 and 40 minutes).
- Sound a bell after a short preparation to demarcate the beginning of meditation.
- While the meditation period is ongoing, do a countdown of the time remaining (not strictly required, but useful for peace of mind in case you’re wondering whether you’ve really only sat for 25 minutes).
- Sound a bell when the meditation ends.
Yes, meditation can get more complex than that. In Zen practice, for example, sometimes you have several periods of varying length, broken up with kinhin (walking meditation). However, that mostly happens in the context of a formal setting (e.g. a Zendo) where you leave your smartphone at the door. Trying to shoehorn all that into an app needlessly complicates what should be simple.
Even worse are the apps which “chart” your progress or have other gimmicks to connect you to a virtual “community” of meditators. I have to say I find that kind of stuff really turns me off. Meditation should be about connecting with reality in a more fundamental way, not charting gamified statistics or interacting online. We already have way too much of that going on elsewhere in our lives without adding even more to it.
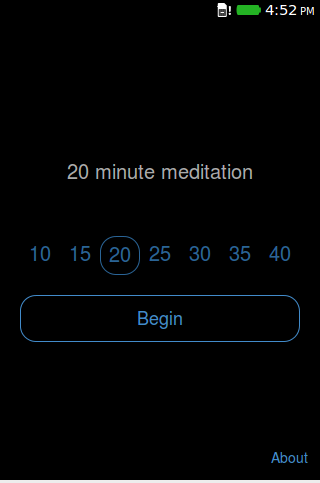
So, you might ask why the alarm feature of most clock apps isn’t sufficient? Really, it is most of the time. A specialized app can make selecting the interval slightly more convenient and we can preselect an appropriate bell sound up front. It’s also nice to hear something to demarcate the start of a meditation session. But honestly I didn’t have much of a reason to write this other than the fact than I could. Outside of work, I’ve been in a bit of a creative rut lately and felt like I needed to build something, anything and put it out into the world (even if it’s tiny and only a very incremental improvement over what’s out there already). So here it is:

The app was written entirely in HTML5 so it should work fine on pretty much any reasonably modern device, desktop or mobile. I tested it on my Nexus 5 (Chrome, Firefox for Android)1, FirefoxOS Flame, and on my laptop (Chrome, Firefox, Safari). It lives on a subdomain of this site or you can grab it from the Firefox Marketplace if you’re using some variant of Firefox (OS). The source, such as it is, can be found on github.
I should acknowledge taking some design inspiration from the Mind application for iOS, which has a similarly minimalistic take on things. Check that out too if you have an iPhone or iPad!
Happy meditating!
1 Note that there isn’t a way to inhibit the screen/device from going to sleep with these browsers, which means that you might miss the ending bell. On FirefoxOS, I used the requestWakeLock API to make sure that doesn’t happen. I filed a bug to get this implemented on Firefox for Android.
[ For more information on the Eideticker software I’m referring to, see this entry ]
Just wanted to write up a few notes on using Eideticker to measure animation smoothness, since this is a topic that comes up pretty often and I wind up explaining these things repeatedly. 😉
When rendering web content, we want the screen to update something like 60 times per second (typical refresh rate of an LCD screen) when an animation or other change is occurring. When this isn’t happening, there is often a user perception of jank (a.k.a. things not working as they should). Generally we express how well we measure up to this ideal by counting the number of “frames per second” that we’re producing. If you’re reading this, you’re probably already familiar with the concept in outline. If you want to know more, you can check out the wikipedia article which goes into more detail.
At an internal level, this concept matches up conceptually with what Gecko is doing. The graphics pipeline produces frames inside graphics memory, which is then sent to the LCD display (whether it be connected to a laptop or a mobile phone) to be viewed. By instrumenting the code, we can see how often this is happening, and whether it is occurring at the right frequency to reach 60 fps. My understanding is that we have at least some code which does exactly this, though I’m not 100% up to date on how accurate it is.
But even assuming the best internal system monitoring, Eideticker might still be useful because:
- It is more “objective”. This is valuable not only for our internal purposes to validate other automation (sometimes internal instrumentation can be off due to a bug or whatever), but also to “prove” to partners that our software has the performance characteristics that we claim.
- The visual artifacts it leaves behind can be valuable for inspection and debugging. i.e. you can correlate videos with profiling information.
Unfortunately, deriving this sort of information from a video capture is more complicated than you’d expect.
What does frames per second even mean?
Given a set of N frames captured from the device, the immediate solution when it comes to “frames per second” is to just compare frames against each other (e.g. by comparing the value of individual pixels) and then counting the ones that are different as “unique frames”. Divide the total number of unique frames by the length of the
capture and… voila? Frames per second? Not quite.
First off, there’s the inherent problem that sometimes the expected behaviour of a test is for the screen to be unchanging for a period of time. For example, at the very beginning of a capture (when we are waiting for the input event to be acknowledged) and at the end (when we are waiting for things to settle). Second, it’s also easy to imagine the display remaining static for a period of time in the middle of a capture (say in between gestures in a multi-part capture). In these cases, there will likely be no observable change on the screen and thus the number of frames counted will be artificially low, skewing the frames per second number down.
Measurement problems
Ok, so you might not consider that class of problem that big a deal. Maybe we could just not consider the frames at the beginning or end of the capture. And for pauses in the middle, as long as we get an absolute number at the end, we’re fine right? That’s at least enough to let us know that we’re getting better or worse, assuming that whatever we’re testing is behaving the same way between runs and we’re just trying to measure how many frames hit the screen.
I might agree with you there, but there’s a further problems that are specific to measuring on-screen performance using a high-speed camera as we are currently with FirefoxOS.
An LCD updates gradually, and not all at once. Remnants of previous frames will remain on screen long past their interval. Take for example these five frames (sampled at 120fps) from a capture of a pan down in the FirefoxOS Contacts application (movie):

Note how if you look closely these 5 frames are actually the intersection of *three* seperate frames. One with “Adam Card” at the top, another with “Barbara Bloomquist” at the top, then another with “Barbara Bloomquist” even further up. Between each frame, artifacts of the previous one are clearly visible.
Plausible sounding solutions:
- Try to resolve the original images by distinguishing “new” content from ghosting artifacts. Sounds possible, but probably hard? I’ve tried a number of simplistic techniques (i.e. trying to find times when change is “peaking”), but nothing has really worked out very well.
- Somehow reverse engineering the interface between the graphics chipset and the LCD panel, and writing some kind of custom hardware to “capture” the framebuffer as it is being sent from one to the other. Also sounds difficult.
- Just forget about this problem altogether and only try to capture periods of time in the capture where the image has stayed static for a sustained period of time (i.e. for say 4–5 frames and up) and we’re pretty sure it’s jank.
Personally the last solution appeals to me the most, although it has the obvious disadvantage of being a “homebrew” metric that no one has ever heard of before, which might make it difficult to use to prove that performance is adequate — the numbers come with a long-winded explanation instead of being something that people immediately understand.
[ For more information on the Eideticker software I’m referring to, see this entry ]
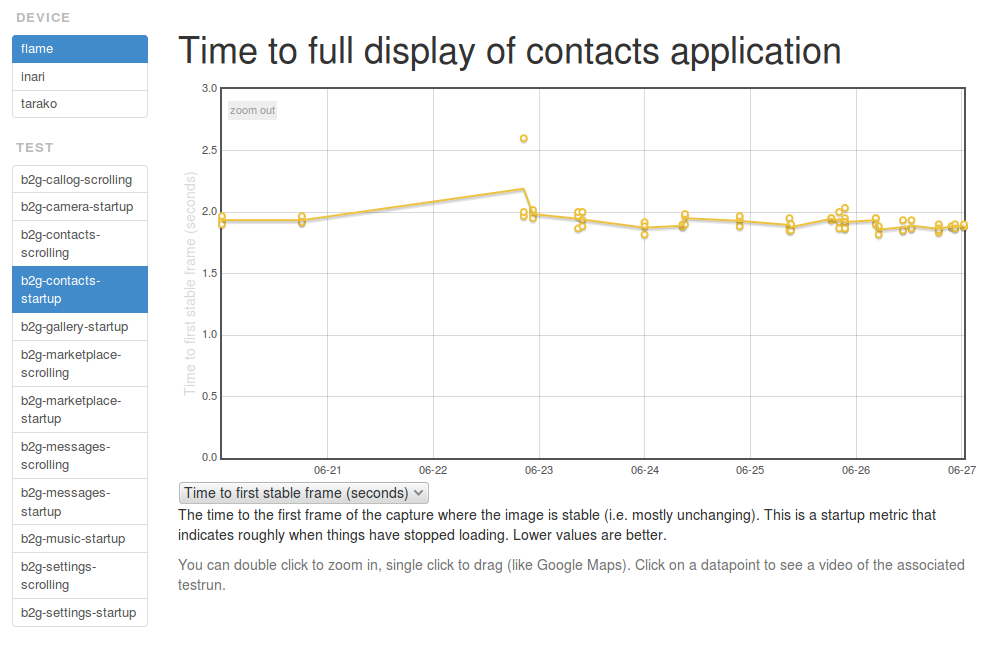
Just wanted to give an update on where Eideticker is at the end of Q2 2014. The big news is that we’ve started to run startup tests against the Flame, the results of which are starting to appear on the dashboard:
 [link]
It is expected that these tests will provide a useful complement to the existing startup tests we’re running with b2gperf, in particular answering the “is this regression real?” question.
Pending work for Q3:
- Enable scrolling tests on the Flame. I got these working against the Hamachi a few months ago but because of some weird input issue we’re seeing we can’t yet enable them on the Flame. This is being tracked in bug 1028824. If anyone has background on the behaviour of the touch screen driver for this device I would appreciate some help.
- Enable tests for multiple branches on the Flame (currently we’re only doing master). This is pretty much ready to go (bug 1017834), just need to land it.
- Annotate eideticker graphs with internal benchmark information. Eli Perelman of the FirefoxOS performance team has come up with a standard set of on-load events for the Gaia apps (app chrome loaded, app content loaded, …) that each app will generate, feeding into tools like b2gperf and test-perf. We want to show this information in Eideticker’s frame-by-frame analysis (example) so we can verify that the app’s behaviour is consistent with what it is claimed. This is being tracked in bug 1018334
- Re-enable Eideticker for Android and run tests more frequently. Sadly we haven’t been consistently generating new Eideticker results for Android for the last quarter because of networking issues in the new Mountain View office, where the test rig for those live. One way or another, we want to fix this next quarter and hopefully run tests more frequently against mozilla-inbound (instead of just nightly builds)
The above isn’t an exhaustive list: there’s much more that we have in mind for the future that’s not yet scheduled or defined well (e.g. get Eideticker reporting to Treeherder’s new performance module). If you have any questions or feedback on anything outlined above I’d love to hear it!
[ For more information on the Eideticker software I’m referring to, see this entry ]
So recently I’ve been exploring new and different methods of measuring things that we care about on FirefoxOS — like startup time or amount of checkerboarding. With Android, where we have a mostly clean signal, these measurements were pretty straightforward. Want to measure startup times? Just capture a video of Firefox starting, then compare the frames pixel by pixel to see how much they differ. When the pixels aren’t that different anymore, we’re “done”. Likewise, to measure checkerboarding we just calculated the areas of the screen where things were not completely drawn yet, frame-by-frame.
On FirefoxOS, where we’re using a camera to measure these things, it has not been so simple. I’ve already discussed this with respect to startup time in a previous post. One of the ideas I talk about there is “entropy” (or the amount of unique information in the frame). It turns out that this is a pretty deep concept, and is useful for even more things than I thought of at the time. Since this is probably a concept that people are going to be thinking/talking about for a while, it’s worth going into a little more detail about the math behind it.
The wikipedia article on information theoretic entropy is a pretty good introduction. You should read it. It all boils down to this formula:

You can see this section of the wikipedia article (and the various articles that it links to) if you want to break down where that comes from, but the short answer is that given a set of random samples, the more different values there are, the higher the entropy will be. Look at it from a probabilistic point of view: if you take a random set of data and want to make predictions on what future data will look like. If it is highly random, it will be harder to predict what comes next. Conversely, if it is more uniform it is easier to predict what form it will take.
Another, possibly more accessible way of thinking about the entropy of a given set of data would be “how well would it compress?”. For example, a bitmap image with nothing but black in it could compress very well as there’s essentially only 1 piece of unique information in it repeated many times — the black pixel. On the other hand, a bitmap image of completely randomly generated pixels would probably compress very badly, as almost every pixel represents several dimensions of unique information. For all the statistics terminology, etc. that’s all the above formula is trying to say.
So we have a model of entropy, now what? For Eideticker, the question is — how can we break the frame data we’re gathering down into a form that’s amenable to this kind of analysis? The approach I took (on the recommendation of this article) was to create a histogram with 256 bins (representing the number of distinct possibilities in a black & white capture) out of all the pixels in the frame, then run the formula over that. The exact function I wound up using looks like this:
def _get_frame_entropy((i, capture, sobelized)):
    frame = capture.get_frame(i, True).astype('float')
    if sobelized:
        frame = ndimage.median_filter(frame, 3)

        dx = ndimage.sobel(frame, 0)  # horizontal derivative
        dy = ndimage.sobel(frame, 1)  # vertical derivative
        frame = numpy.hypot(dx, dy)  # magnitude
        frame *= 255.0 / numpy.max(frame)  # normalize (Q&D)

    histogram = numpy.histogram(frame, bins=256)[0]
    histogram_length = sum(histogram)
    samples_probability = [float(h) / histogram_length for h in histogram]
    entropy = -sum([p * math.log(p, 2) for p in samples_probability if p != 0])

    return entropy
[Context]
The “sobelized” bit allows us to optionally convolve the frame with a sobel filter before running the entropy calculation, which removes most of the data in the capture except for the edges. This is especially useful for FirefoxOS, where the signal has quite a bit of random noise from ambient lighting that artificially inflate the entropy values even in places where there is little actual “information”.
This type of transformation often reveals very interesting information about what’s going on in an eideticker test. For example, take this video of the user panning down in the contacts app:
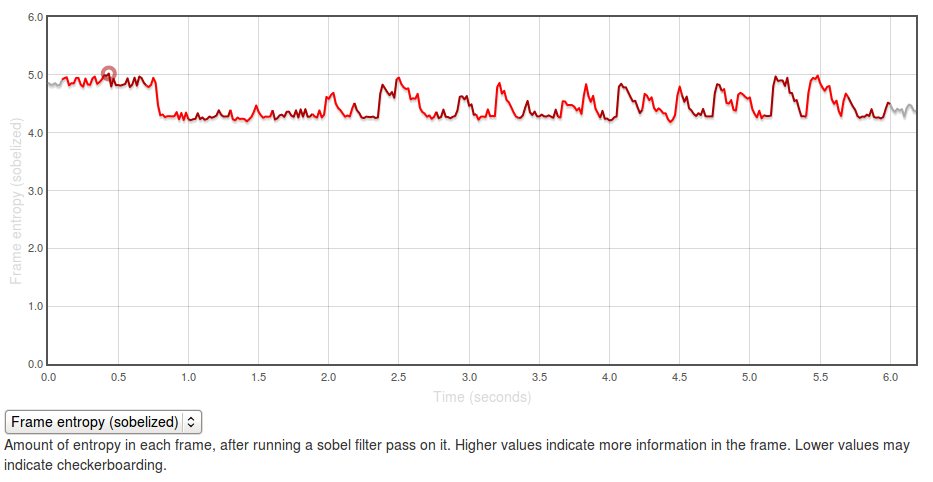
If you graph the entropies of the frame of the capture using the formula above you, you get a graph like this:

[Link to original]
The Y axis represents entropy, as calculated by the code above. There is no inherently “right” value for this — it all depends on the application you’re testing and what you expect to see displayed on the screen. In general though, higher values are better as it indicates more frames of the capture are “complete”.
The region at the beginning where it is at about 5.0 represents the contacts app with a set of contacts fully displayed (at startup). The “flat” regions where the entropy is at roughly 4.25? Those are the areas where the app is “checkerboarding” (blanking out waiting for graphics or layout engine to draw contact information). Click through to the original and swipe over the graph to see what I mean.
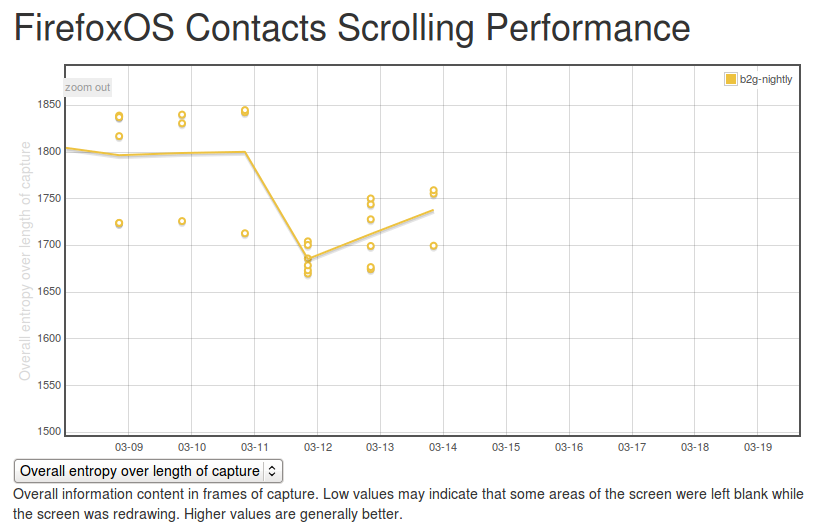
It’s easy to see what a hypothetical ideal end state would be for this capture: a graph with a smooth entropy of about 5.0 (similar to the start state, where all contacts are fully drawn in). We can track our progress towards this goal (or our deviation from it), by watching the eideticker b2g dashboard and seeing if the summation of the entropy values for frames over the entire test increases or decreases over time. If we see it generally increase, that probably means we’re seeing less checkerboarding in the capture. If we see it decrease, that might mean we’re now seeing checkerboarding where we weren’t before.
It’s too early to say for sure, but over the past few days the trend has been positive:

[Link to original]
(note that there were some problems in the way the tests were being run before, so results before the 12th should not be considered valid)
So one concept, at least two relevant metrics we can measure with it (startup time and checkerboarding). Are there any more? Almost certainly, let’s find them!
[ For more information on the Eideticker software I’m referring to, see this entry ]
Time for a long overdue eideticker-for-firefoxos update. Last time we were here (almost 5 months ago! man time flies), I was discussing methodologies for measuring startup performance. Since then, Dave Hunt and myself have been doing lots of work to make Eideticker more robust and useful. Notably, we now have a setup in London running a suite of Eideticker tests on the latest version of FirefoxOS on the Inari on a daily basis, reporting to http://eideticker.mozilla.org/b2g.

There were more than a few false starts with and some of the earlier data is not to be entirely trusted but it now seems to be chugging along nicely, hopefully providing startup numbers that provide a useful counterpoint to the datazilla startup numbers we’ve already been collecting for some time. There still seem to be some minor problems, but in general I am becoming more and more confident in it as time goes on.
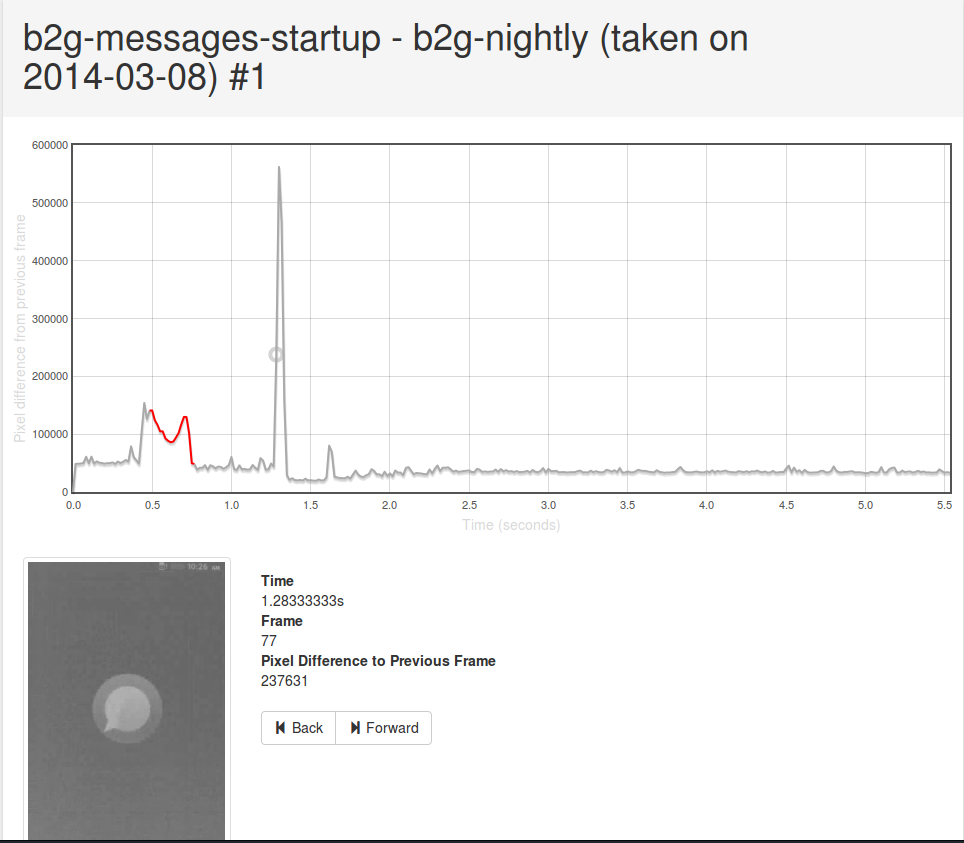
One feature that I am particularly proud of is the detail view, which enables you to see frame-by-frame what’s going on. Click on any datapoint on the graph, then open up the view that gives an account of what eideticker is measuring. Hover over the graph and you can see what the video looks like at any point in the capture. This not only lets you know that something regressed, but how. For example, in the messages app, you can scan through this view to see exactly when the first message shows up, and what exact state the application is in when Eideticker says it’s “done loading”.

[link to original]
(apologies for the low quality of the video — should be fixed with this bug next week)
As it turns out, this view has also proven to be particularly useful when working with the new entropy measurements in Eideticker which I’ve been using to measure checkerboarding (redraw delay) on FirefoxOS. More on that next week.
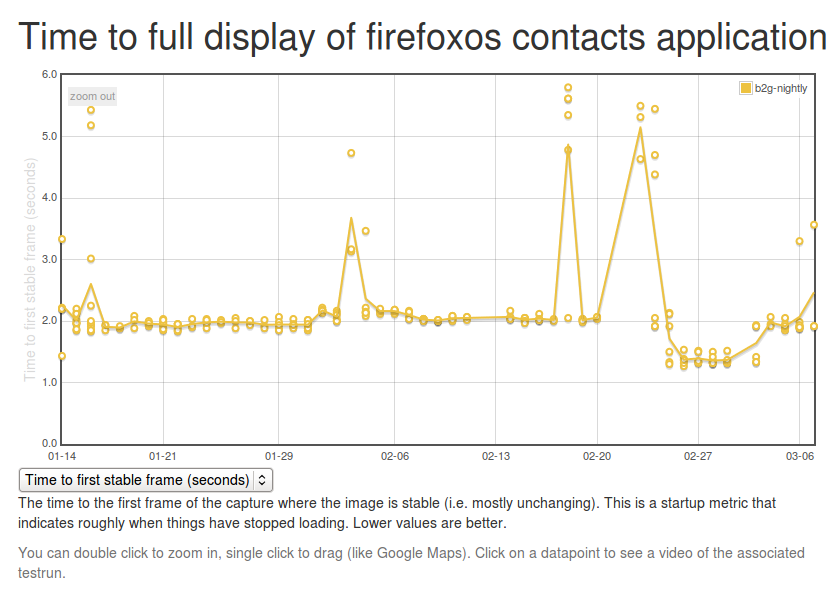
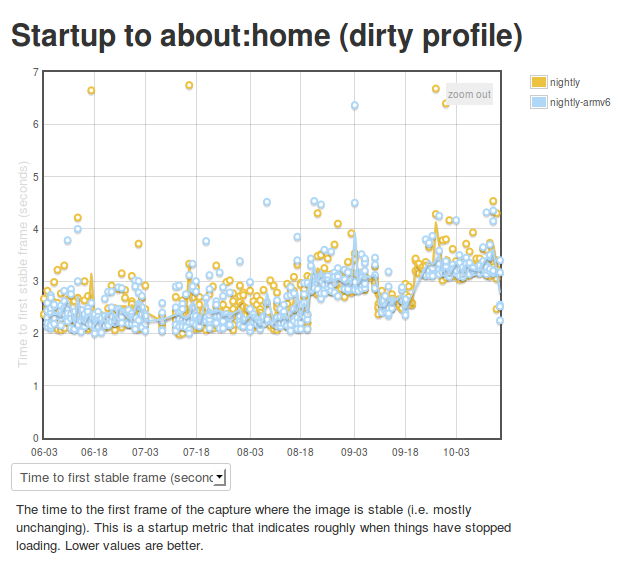
So we’ve been using Eideticker to automatically measure startup/pageload times for about a year now on Android, and more recently on FirefoxOS as well (albeit not automatically). This gives us nice and pretty graphs like this:

Ok, so we’re generating numbers and graphing them. That’s great. But what’s really going on behind the scenes? I’m glad you asked. The story is a bit different depending on which platform you’re talking about.
Android
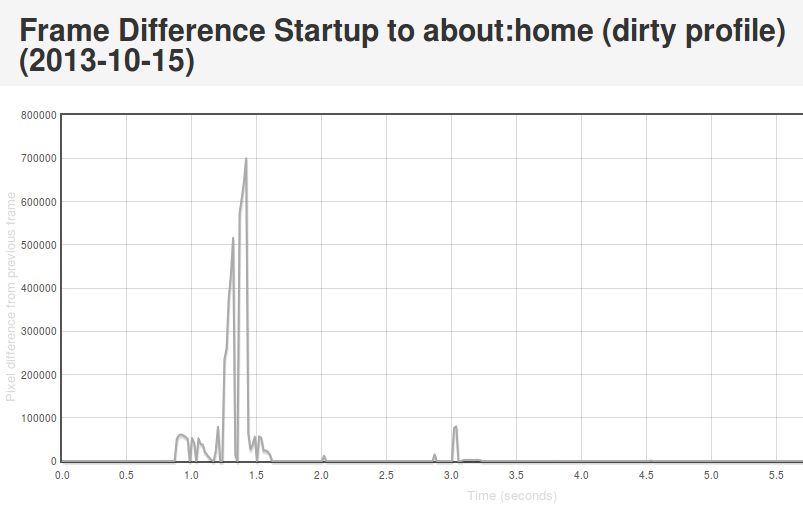
On Android we connect Eideticker to the device’s HDMI out, so we count on a nearly pixel-perfect signal. In practice, it isn’t quite, but it is within a few RGB values that we can easily filter for. This lets us come up with a pretty good mechanism for determining when a page load or app startup is finished: just compare frames, and say we’ve “stopped” when the pixel differences between frames are negligible (previously defined at 2048 pixels, now 4096 — see below). Eideticker’s new frame difference view lets us see how this works. Look at this graph of application startup:

[Link to original]
What’s going on here? Well, we see some huge jumps in the beginning. This represents the animated transitions that Android makes as we transition from the SUTAgent application (don’t ask) to the beginnings of the FirefoxOS browser chrome. You’ll notice though that there’s some more changes that come in around the 3 second mark. This is when the site bookmarks are fully loaded. If you load the original page (link above) and swipe your mouse over the graph, you can see what’s going on for yourself.
This approach is not completely without problems. It turns out that there is sometimes some minor churn in the display even when the app is for all intents and purposes started. For example, sometimes the scrollbar fading out of view can result in a significantish pixel value change, so I recently upped the threshold of pixels that are different from 2048 to 4096. We also recently encountered a silly problem with a random automation app displaying “toasts” which caused results to artificially spike. More tweaking may still be required. However, on the whole I’m pretty happy with this solution. It gives useful, undeniably objective results whose meaning is easy to understand.
FirefoxOS
So as mentioned previously, we use a camera on FirefoxOS to record output instead of HDMI output. Pretty unsurprisingly, this is much noisier. See this movie of the contacts app starting and note all the random lighting changes, for example:
My experience has been that pixel differences can be so great between visually identical frames on an eideticker capture on these devices that it’s pretty much impossible to settle on when startup is done using the frame difference method. It’s of course possible to detect very large scale changes, but the small scale ones (like the contacts actually appearing in the example above) are very hard to distinguish from random differences in the amount of light absorbed by the camera sensor. Tricks like using median filtering (a.k.a. “blurring”) help a bit, but not much. Take a look at this graph, for example:
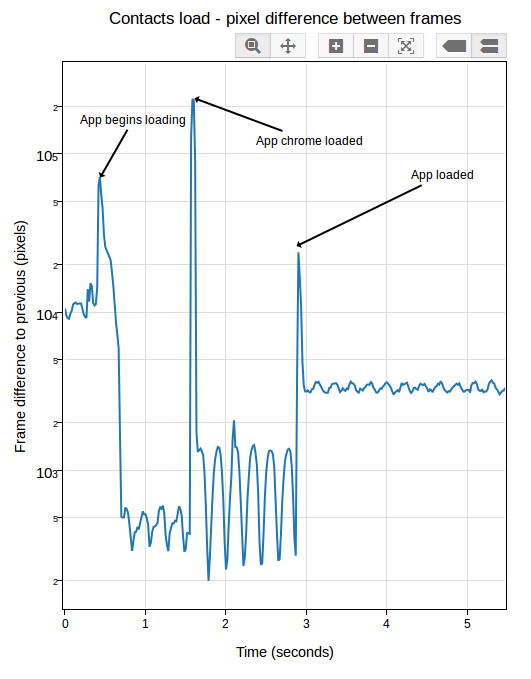
[Link to original]
You’ll note that the pixel differences during “static” parts of the capture are highly variable. This is because the pixel difference depends heavily on how “bright” each frame is: parts of the capture which are black (e.g. a contacts icon with a black background) have a much lower difference between them than parts that are bright (e.g. the contacts screen fully loaded).
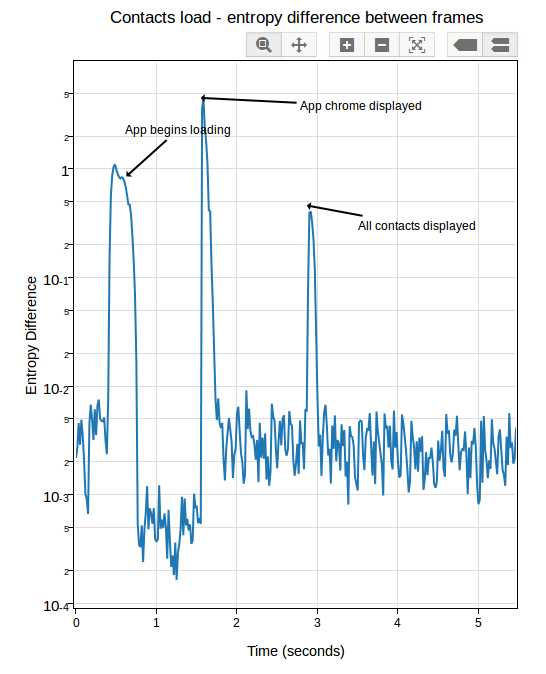
After a day or so of experimenting and research, I settled on an approach which seems to work pretty reliably. Instead of comparing the frames directly, I measure the entropy of the histogram of colours used in each frame (essentially just an indication of brightness in this case, see this article for more on calculating it), then compare that of each frame with the average of the same measure over 5 previous frames (to account for the fact that two frames may be arbitrarily different, but that is unlikely that a sequence of frames will be). This seems to work much better than frame difference in this environment: although there are plenty of minute differences in light absorption in a capture from this camera, the overall color composition stays mostly the same. See this graph:

[Link to original]
If you look closely, you can see some minor variance in the entropy differences depending on the state of the screen, but it’s not nearly as pronounced as before. In practice, I’ve been able to get extremely consistent numbers with a reasonable “threshold” of “0.05”.
In Eideticker I’ve tried to steer away from using really complicated math or algorithms to measure things, unless all the alternatives fail. In that sense, I really liked the simplicity of “pixel differences” and am not thrilled about having to resort to this: hopefully the concepts in this case (histograms and entropy) are simple enough that most people will be able to understand my methodology, if they care to. Likely I will need to come up with something else for measuring responsiveness and animation smoothness (frames per second), as likely we can’t count on light composition changing the same way for those cases. My initial thought was to use edge detection (which, while somewhat complex to calculate, is at least easy to understand conceptually) but am open to other ideas.
Today I did a quick port of Larry Doolittle’s ntpclient program to Android and FirefoxOS. Basically this lets you easily synchronize your device’s time to that of a central server. Yes, there’s lots and lots of Android “applications” which let you do this, but I wanted to be able to do this from the command line because that’s how I roll. If you’re interested, source and instructions are here:
https://github.com/wlach/ntpclient-android
For those curious, no, I didn’t just do this for fun. For next quarter, we want to write some Eideticker-based responsiveness tests for FirefoxOS and Android. For example, how long does it take from the time you tap on an icon in the homescreen on FirefoxOS to when the application is fully loaded? Or on Android, how long does it take to see a full list of sites in the awesomebar from the time you tap on the URL field and enter your search term?
Because an Eideticker test run involves two different machines (a host machine which controls the device and captures video of it in action, as well as the device itself), we need to use timestamps to really understand when and how events are being sent to the device. To do that reliably, we really need some easy way of synchronizing time between two machines (or at least accounting for the difference in their clocks, which amounts to about the same thing). NTP struck me as being the easiest, most standard way of doing this.
[ For more information on the Eideticker software I’m referring to, see this entry ]
I just put up a proof of concept Eideticker dashboard for FirefoxOS here. Right now it has two days worth of data, manually sampled from an Unagi device running b2g18. Right now there are two tests: one the measures the “speed” of the contacts application scrolling, another that measures the amount of time it takes for the contacts application to be fully loaded.
For those not already familiar with it, Eideticker is a benchmarking suite which captures live video data coming from a device and analyzes it to determine performance. This lets us get data which is more representative of actual user experience (as opposed to an oft artificial benchmark). For example, Eideticker measures contacts startup as taking anywhere between 3.5 seconds and 4.5 seconds, versus than the 0.5 to 1 seconds that the existing datazilla benchmarks show. What accounts for the difference? If you step through an eideticker-captured video, you can see that even though something appears very quickly, not all the contacts are displayed until the 3.5 second mark. There is a gap between an app being reported as “loaded” and it being fully available for use, which we had not been measuring until now.
At this point, I am most interested in hearing from FirefoxOS developers on new tests that would be interesting and useful to track performance of the system on an ongoing basis. I’d obviously prefer to focus on things which have been difficult to measure accurately through other means. My setup is rather fiddly right now, but hopefully soon we can get some useful numbers going on an ongoing basis, as we do already for Firefox for Android.
Another update on getting Eideticker working with FirefoxOS. Once again this is sort of high-level, looking forward to writing something more in-depth soon now that we have the basics working.
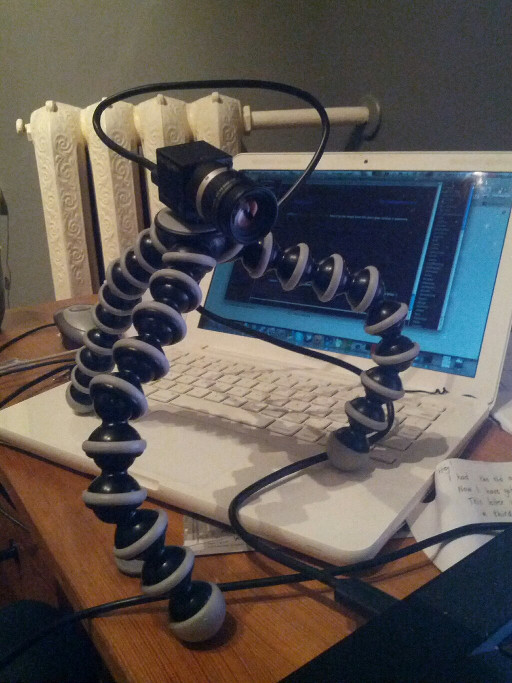
I finally got the last kinks out of the rig I was using to capture live video from FirefoxOS phones using the Point Grey devices last week. In order to make things reasonable I had to write some custom code to isolate the actual device screen from the rest of capture and a few other things. The setup looks interesting (reminds me a bit of something out of the War of the Worlds):

Here’s some example video of a test I wrote up to measure the performance of contacts scrolling performance (measured at a very respectable 44 frames per second, in case you wondering):
Surprisingly enough, I didn’t wind up having to write up any code to compensate for a noisy image. Of course there’s a certain amount of variance in every frame depending on how much light is hitting the camera sensor at any particular moment, but apparently not enough to interfere with getting useful results in the tests I’ve been running.
Likely next step: Create some kind of chassis for mounting both the camera and device on a permanent basis (instead of an adhoc one on my desk) so we can start running these sorts of tests on a daily basis, much like we currently do with Android on the Eideticker Dashboard.
As an aside, I’ve been really impressed with both the Marionette framework and the gaiatests python module that was written up for FirefoxOS. Writing the above test took just 5 minutes — and the code is quite straightforward. Quite the pleasant change from my various efforts in Android automation.
