More Perfherder updates
Aug 7th, 2015
Since my last update, we’ve been trucking along with improvements to Perfherder, the project for making Firefox performance sheriffing and analysis easier.
Compare visualization improvements
I’ve been spending quite a bit of time trying to fix up the display of information in the compare view, to address feedback from developers and hopefully generally streamline things. Vladan (from the perf team) referred me to Blake Winton, who provided tons of awesome suggestions on how to present things more concisely.
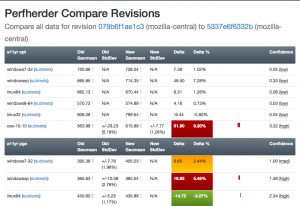
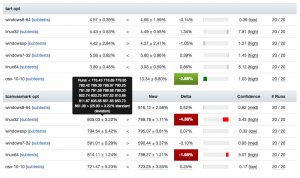
Here’s an old versus new picture:
 |
 |
Summary of significant changes in this view:
- Removed or consolidated several types of numerical information which were overwhelming or confusing (e.g. presenting both numerical and percentage standard deviation in their own columns).
- Added tooltips all over the place to explain what’s being displayed.
- Highlight more strongly when it appears there aren’t enough runs to make a definitive determination on whether there was a regression or improvement.
- Improve display of visual indicator of magnitude of regression/improvement (providing a pseudo-scale showing where the change ranges from 0% : 20%+).
- Provide more detail on the two changesets being compared in the header and make it easier to retrigger them (thanks to Mike Ling).
- Much better and more intuitive error handling when something goes wrong (also thanks to Mike Ling).
The point of these changes isn’t necessarily to make everything “immediately obvious” to people. We’re not building general purpose software here: Perfherder will always be a rather specialized tool which presumes significant domain knowledge on the part of the people using it. However, even for our audience, it turns out that there’s a lot of room to improve how our presentation: reducing the amount of extraneous noise helps people zero in on the things they really need to care about.
Special thanks to everyone who took time out of their schedules to provide so much good feedback, in particular Avi Halmachi, Glandium, and Joel Maher.
Of course more suggestions are always welcome. Please give it a try and file bugs against the perfherder component if you find anything you’d like to see changed or improved.
Getting the word out
Hammersmith:mozilla-central wlach$ hg push -f try
pushing to ssh://hg.mozilla.org/try
no revisions specified to push; using . to avoid pushing multiple heads
searching for changes
remote: waiting for lock on repository /repo/hg/mozilla/try held by 'hgssh1.dmz.scl3.mozilla.com:8270'
remote: got lock after 4 seconds
remote: adding changesets
remote: adding manifests
remote: adding file changes
remote: added 1 changesets with 1 changes to 1 files
remote: Trying to insert into pushlog.
remote: Inserted into the pushlog db successfully.
remote:
remote: View your change here:
remote:   https://hg.mozilla.org/try/rev/e0aa56fb4ace
remote:
remote: Follow the progress of your build on Treeherder:
remote:   https://treeherder.mozilla.org/#/jobs?repo=try&revision=e0aa56fb4ace
remote:
remote: It looks like this try push has talos jobs. Compare performance against a baseline revision:
remote:   https://treeherder.mozilla.org/perf.html#/comparechooser?newProject=try&newRevision=e0aa56fb4ace
Try pushes incorporating Talos jobs now automatically link to perfherder’s compare view, both in the output from mercurial and in the emails the system sends. One of the challenges we’ve been facing up to this point is just letting developers know that Perfherder exists and it can help them either avoid or resolve performance regressions. I believe this will help.
Data quality and ingestion improvements
Over the past couple weeks, we’ve been comparing our regression detection code when run against Graphserver data to Perfherder data. In doing so, we discovered that we’ve sometimes been using the wrong algorithm (geometric mean) to summarize some of our tests, leading to unexpected and less meaningful results. For example, the v8_7 benchmark uses a custom weighting algorithm for its score, to account for the fact that the things it tests have a particular range of expected values.
To hopefully prevent this from happening again in the future, we’ve decided to move the test summarization code out of Perfherder back into Talos (bug 1184966). This has the additional benefit of creating a stronger connection between the content of the Talos logs and what Perfherder displays in its comparison and graph views, which has thrown people off in the past.
Continuing data challenges
Having better tools for visualizing this stuff is great, but it also highlights some continuing problems we’ve had with data quality. It turns out that our automation setup often produces qualitatively different performance results for the exact same set of data, depending on when and how the tests are run.
A certain amount of random noise is always expected when running performance tests. As much as we might try to make them uniform, our testing machines and environments are just not 100% identical. That we expect and can deal with: our standard approach is just to retrigger runs, to make sure we get a representative sample of data from our population of machines.
The problem comes when there’s a pattern to the noise: we’ve already noticed that tests run on the weekends produce different results (see Joel’s post from a year ago, “A case of the weekends”) but it seems as if there’s other circumstances where one set of results will be different from another, depending on the time that each set of tests was run. Some tests and platforms (e.g. the a11yr suite, MacOS X 10.10) seem particularly susceptible to this issue.
We need to find better ways of dealing with this problem, as it can result in a lot of wasted time and energy, for both sheriffs and developers. See for example bug 1190877, which concerned a completely spurious regression on the tresize benchmark that was initially blamed on some changes to the media code: in this case, Joel speculates that the linux64 test machines we use might have changed from under us in some way, but we really don’t know yet.
I see two approaches possible here:
- Figure out what’s causing the same machines to produce qualitatively different result distributions and address that. This is of course the ideal solution, but it requires coordination with other parts of the organization who are likely quite busy and might be hard.
- Figure out better ways of detecting and managing these sorts of case. I have noticed that the standard deviation inside the results when we have spurious regressions/improvements tends to be higher (see for example this compare view for the aforementioned “regression”). Knowing what we do, maybe there’s some statistical methods we can use to detect bad data?
For now, I’m leaning towards (2). I don’t think we’ll ever completely solve this problem and I think coming up with better approaches to understanding and managing it will pay the largest dividends. Open to other opinions of course!