Mission Control
Oct 6th, 2017
Time for an overdue post on the mission control project that I’ve been working on for the past few quarters, since I transitioned to the data platform team.
One of the gaps in our data story when it comes to Firefox is being able to see how a new release is doing in the immediate hours after release. Tools like crashstats and the telemetry evolution dashboard are great, but it can take many hours (if not days) before you can reliably see that there is an issue in a metric that we care about (number of crashes, say). This is just too long — such delays unnecessarily retard rolling out a release when it is safe (because there is a paranoia that there might be some lingering problem which we we’re waiting to see reported). And if, somehow, despite our abundant caution a problem did slip through it would take us some time to recognize it and roll out a fix.
Enter mission control. By hooking up a high-performance spark streaming job directly to our ingestion pipeline, we can now be able to detect within moments whether firefox is performing unacceptably within the field according to a particular measure.
To make the volume of data manageable, we create a grouped data set with the raw count of the various measures (e.g. main crashes, content crashes, slow script dialog counts) along with each unique combination of dimensions (e.g. platform, channel, release).
Of course, all this data is not so useful without a tool to visualize it, which is what I’ve been spending the majority of my time on. The idea is to be able to go from a top level description of what’s going on a particular channel (release for example) all the way down to a detailed view of how a measure has been performing over a time interval:
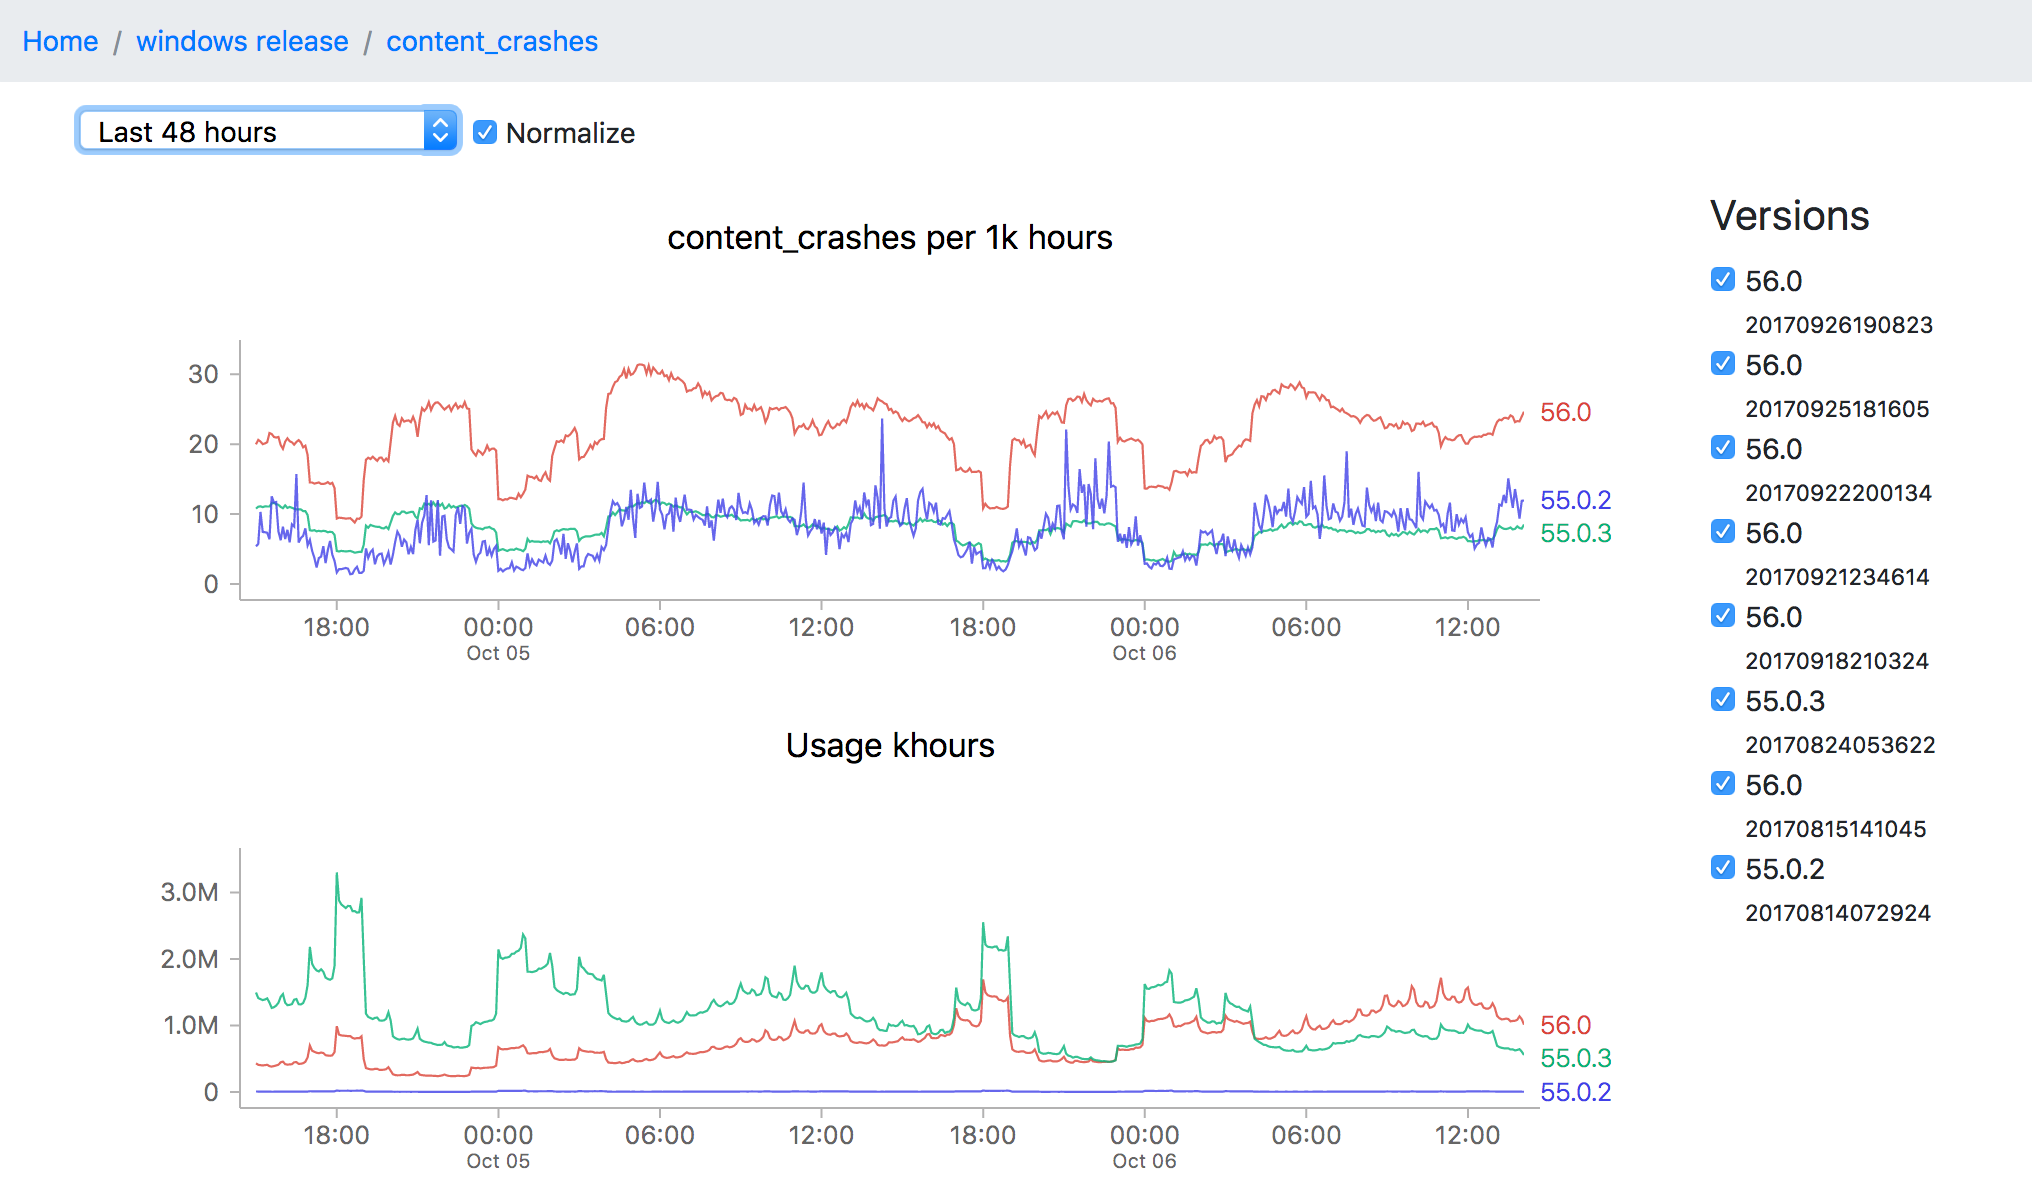
This particular screenshot shows the volume of content crashes (sampled every 5 minutes) over the last 48 hours on windows release. You’ll note that the later version (56.0) seems to be much crashier than earlier versions (55.0.3) which would seem to be a problem except that the populations are not directly comparable (since the profile of a user still on an older version of Firefox is rather different from that of one who has already upgraded). This is one of the still unsolved problems of this project: finding a reliable, automatable baseline of what an “acceptable result” for any particular measure might be.
Even still, the tool can still be useful for exploring a bunch of data quickly and it has been progressing rapidly over the last few weeks. And like almost everything Mozilla does, both the source and dashboard are open to the public. I’m planning on flagging some easier bugs for newer contributors to work on in the next couple weeks, but in the meantime if you’re interested in this project and want to get involved, feel free to look us up on irc.mozilla.org #missioncontrol (I’m there as ‘wlach’).