Mozilla Telemetry in 2020: From “Just Firefox” to a “Galaxy of Data”
Jul 16th, 2020
(“This Week in Glean” is a series of blog posts that the Glean Team at Mozilla is using to try to communicate better about our work. They could be release notes, documentation, hopes, dreams, or whatever: so long as it is inspired by Glean. You can find an index of all TWiG posts online.)
This is a special guest post by non-Glean-team member William Lachance!
In the last year or so, there’s been a significant shift in the way we (Data Engineering) think about application-submitted data @ Mozilla, but although we have a new application-based SDK based on these principles (the Glean SDK), most of our data tools and documentation have not yet been updated to reflect this new state of affairs.
Much of this story is known inside Mozilla Data Engineering, but I thought it might be worth jotting them down into a blog post as a point of reference for people outside the immediate team. Knowing this may provide some context for some our activities and efforts over the next year or two, at least until our tools, documentation, and tribal knowledge evolve.
In sum, the key differences are:
- Instead of just one application we care about, there are many.
- Instead of just caring about (mostly1) one type of ping (the Firefox main ping), an individual application may submit many different types of pings in the course of their use.
- Instead of having both probes (histogram, scalar, or other data type) and bespoke parametric values in a JSON schema like the telemetry environment, there are now only metric types which are explicitly defined as part of each ping.
The new world is pretty exciting and freeing, but there is some new domain complexity that we need to figure out how to navigate. I’ll discuss that in my last section.
The Old World: Firefox is king
Up until roughly mid–2019, Firefox was the centre of Mozilla’s data world (with the occasional nod to Firefox for Android, which uses the same source repository). The Data Platform (often called “Telemetry”) was explicitly designed to cater to the needs of Firefox Developers (and to a lesser extent, product/program managers) and a set of bespoke tooling was built on top of our data pipeline architecture - this blog post from 2017 describes much of it.
In outline, the model is simple: on the client side, assuming a given user had not turned off Telemetry, during the course of a day’s operation Firefox would keep track of various measures, called “probes”. At the end of that duration, it would submit a JSON-encoded “main ping” to our servers with the probe information and a bunch of other mostly hand-specified junk, which would then find its way to a “data lake” (read: an Amazon S3 bucket). On top of this, we provided a python API (built on top of PySpark) which enabled people inside Mozilla to query all submitted pings across our usage population.
The only type of low-level object that was hard to keep track of was the list of probes: Firefox is a complex piece of software and there are many aspects of it we wanted to instrument to validate performance and quality of the product - especially on the more-experimental Nightly and Beta channels. To solve this problem, a probe dictionary was created to help developers find measures that corresponded to the product area that they were interested in.
On a higher-level, accessing this type of data using the python API quickly became slow and frustrating: the aggregation of years of Firefox ping data was hundreds of terabytes big, and even taking advantage of PySpark’s impressive capabilities, querying the data across any reasonably large timescale was slow and expensive. Here, the solution was to create derived datasets which enabled fast(er) access to pings and other derived measures, document them on docs.telemetry.mozilla.org, and then allow access to them through tools like sql.telemetry.mozilla.org or the Measurement Dashboard.
The New World: More of everything
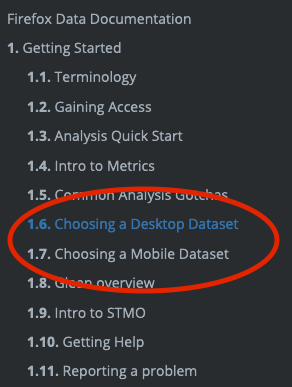
Even in the old world, other products that submitted telemetry existed (e.g. Firefox for Android, Firefox for iOS, the venerable FirefoxOS) but I would not call them first-class citizens. Most of our documentation treated them as (at best) weird edge cases. At the time of this writing, you can see this distinction clearly on docs.telemetry.mozilla.org where there is one (fairly detailed) tutorial called “Choosing a Desktop Dataset” while essentially all other products are lumped into “Choosing a Mobile Dataset”.
While the new universe of mobile products are probably the most notable addition to our list of things we want to keep track of, they’re only one piece of the puzzle. Really we’re interested in measuring all the things (in accordance with our lean data practices, of course) including tools we use to build our products like mozphab and mozregression.
In expanding our scope, we’ve found that mobile (and other products) have different requirements that influence what data we would want to send and when. For example, sending one blob of JSON multiple times per day might make sense for performance metrics on a desktop product (which is usually on a fast, unmetered network) but is much less acceptable on mobile (where every byte counts). For this reason, it makes sense to have different ping types for the same product, not just one. For example, Fenix (the new Firefox for Android) sends a tiny baseline ping2 on every run to (roughly) measure daily active users and a larger metrics ping sent on a (roughly) daily interval to measure (for example) a distribution of page load times.
Finally, we found that naively collecting certain types of data as raw histograms or inside the schema didn’t always work well. For example, encoding session lengths as plain integers would often produce weird results in the case of clock skew. For this reason, we decided to standardize on a set of well-defined metrics using Glean, which tries to minimize footguns. We explicitly no longer allow clients to submit arbitrary JSON or values as part of a telemetry ping: if you have a use case not covered by the existing metrics, make a case for it and add it to the list!
To illustrate this, let’s take a (subset) of what we might be looking at in terms of what the Fenix application sends:
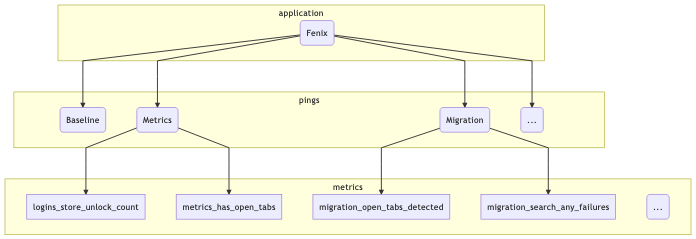
At the top level we segment based on the “application” (just Fenix in this example). Just below that, there are the pings that this application might submit (I listed three: the baseline and metrics pings described above, along with a “migration” ping, which tracks metrics when a user migrates from Fennec to Fenix). And below that there are different types of metrics included in the pings: I listed a few that came out of a quick scan of the Fenix BigQuery tables using my prototype schema dictionary.
This is actually only the surface-level: at the time of this writing, Fenix has no fewer than 12 different ping types and many different metrics inside each of them.3 On a client level, the new Glean SDK provides easy-to-use primitives to help developers collect this type of information in a principled, privacy-preserving way: for example, data review is built into every metric type. But what about after it hits our ingestion endpoints?
Hand-crafting schemas, data ingestion pipelines, and individualized ETL scripts for such a large matrix of applications, ping types, and measurements would quickly become intractable. Instead, we (Mozilla Data Engineering) refactored our data pipeline to parse out the information from the Glean schemas and then create tables in our BigQuery datastore corresponding to what’s in them - this has proceeded as an extension to our (now somewhat misnamed) probe-scraper tool.
You can then query this data directly (see accessing glean data) or build up a derived dataset using our SQL-based ETL system, BigQuery-ETL. This part of the equation has been working fairly well, I’d say: we now have a diverse set of products producing Glean telemetry and submitting it to our servers, and the amount of manual effort required to add each application was minimal (aside from adding new capabilities to the platform as we went along).
What hasn’t quite kept pace is our tooling to make navigating and using this new collection of data tractable.
What could bring this all together?
As mentioned before, this new world is quite powerful and gives Mozilla a bunch of new capabilities but it isn’t yet well documented and we lack the tools to easily connect the dots from “I have a product question” to “I know how to write an SQL query / Spark Job to answer it” or (better yet) “this product dashboard will answer it”.
Up until now, our defacto answer has been some combination of “Use the probe dictionary / telemetry.mozilla.org” and/or “refer to docs.telemetry.mozilla.org”. I submit that we’re at the point where these approaches break down: as mentioned above, there are many more types of data we now need to care about than just “probes” (or “metrics”, in Glean-parlance). When we just cared about the main ping, we could write dataset documentation for its recommended access point (main_summary) and the raw number of derived datasets was managable. But in this new world, where we have N applications times M ping types, the number of canonical ping tables are now so many that documenting them all on docs.telemetry.mozilla.org no longer makes sense.
A few months ago, I thought that Google’s Data Catalog (billed as offering “a unified view of all your datasets”) might provide a solution, but on further examination it only solves part of the problem: it provides only a view on your BigQuery tables and it isn’t designed to provide detailed information on the domain objects we care about (products, pings, measures, and tools). You can map some of the properties from these objects onto the tables (e.g. adding a probe’s description field to the column representing it in the BigQuery table), but Data Calalog’s interface to surfacing and filtering through this information is rather slow and clumsy and requires detailed knowledge of how these higher level concepts relate to BigQuery primitives.
Instead, what I think we need is a new system which allows a data practitioner (Data Scientist, Firefox Engineer, Data Engineer, Product Manager, whoever) to visualize the relevant set of domain objects relevant to their product/feature of interest quickly then map them to specific BigQuery tables and other resources (e.g. visualizations using tools like GLAM) which allow people to quickly answer questions so we can make better products. Basically, I am thinking of some combination of:
- The existing probe dictionary (derived from existing product metadata)
- A new “application” dictionary (derived from some simple to-be-defined application metadata description)
- A new “ping” dictionary (derived from existing product metadata)
- A BigQuery schema dictionary (I wrote up a prototype of this a couple weeks ago) to map between these higher-level objects and what’s in our low-level data store
- Documentation for derived datasets generated by BigQuery-ETL (ideally stored alongside the ETL code itself, so it’s easy to keep up to date)
- A data tool dictionary describing how to easily access the above data in various ways (e.g. SQL query, dashboard plot, etc.)
This might sound ambitious, but it’s basically just a system for collecting and visualizing various types of documentation— something we have proven we know how to do. And I think a product like this could be incredibly empowering, not only for the internal audience at Mozilla but also the external audience who wants to support us but has valid concerns about what we’re collecting and why: since this system is based entirely on systems which are already open (inside GitHub or Mercurial repositories), there is no reason we can’t make it available to the public.
-
Technically, there are various other types of pings submitted by Firefox, but the main ping is the one 99% of people care about. ↩
-
This is actually a capability that the Glean SDK provides, so other products (e.g. Lockwise, Firefox for iOS) also benefit from this capability. ↩
-
The scope of this data collection comes from the fact that Fenix is a very large and complex application. rather than a desire to collect everything just because we can— smaller efforts like mozregression collect a much more limited set of data. ↩