First Eideticker Responsiveness Tests
Oct 7th, 2013
[ For more information on the Eideticker software I’m referring to, see this entry ]
Time for another update on Eideticker. In the last quarter, I’ve been working on two main items:
- Responsiveness tests (Android / FirefoxOS)
- Eideticker for FirefoxOS
The focus of this post is the responsiveness work. I’ll talk about Eideticker for FirefoxOS soon.
So what do I mean by responsiveness? At a high-level, I mean how quickly one sees a response after performing an action on the device. For example, if I perform a swipe gesture to scroll the content down while browsing CNN.com, how long does it take after
I start the gesture for the content to visibly scroll down? If you break it down, there’s a multi-step process that happens behind the scenes after a user action like this:
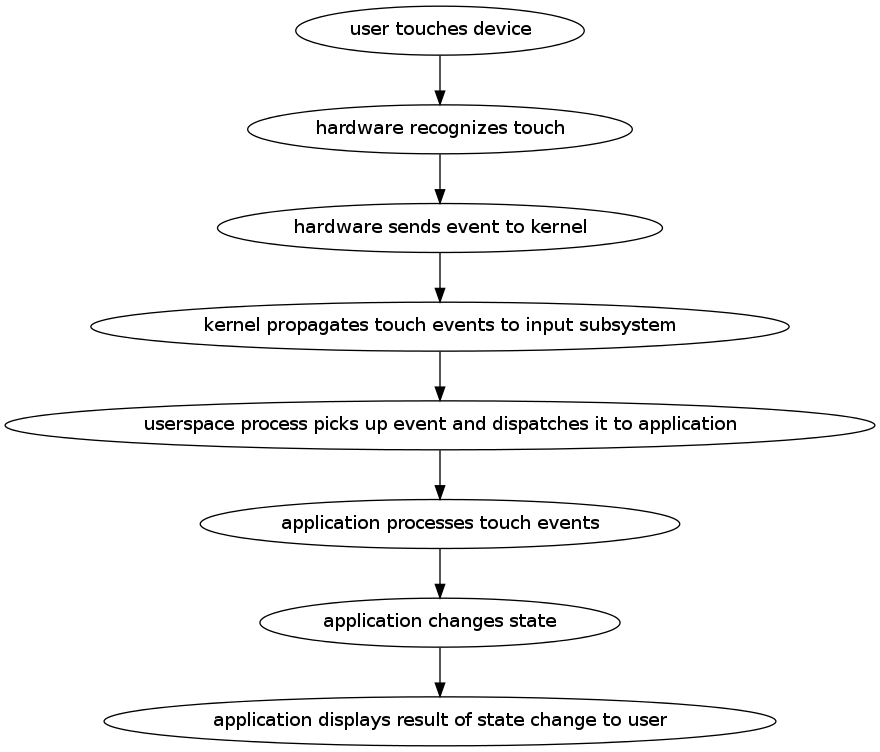
If anywhere in the steps above, there is a significant delay, the user experience is likely to be bad. Usability research
suggests that any lag that is consistently above 100 milliseconds will lead the user to perceive things as being laggy. To keep our users happy, we need to do our bit to make sure that we respond quickly at all levels that we control (just the application layer on Android, but pretty much everything on FirefoxOS). Even if we can’t complete the work required on our end to completely respond to the user’s desire, we should at least display something to acknowledge that things have changed.
But you can’t improve what you can’t measure. Fortunately, we have the means to do calculate of the time delta between most of the steps above. I learned from Taras Glek this weekend that it should be possible to simulate the actual capacitative touch event on a modern touch screen. We can recognize when the hardware event is available to be consumed by userspace by monitoring the `/dev/input` subsystem. And once the event reaches the application (the Android or FirefoxOS application) there’s no reason we can’t add instrumentation in all sorts of places to track the processing of both the event and the rendering of the response.
My working hypothesis is that it’s application-level latency (i.e. the time between the application receiving the event and being able to act on it) that dominates, so that’s what I decided to measure. This is purely based on intuition and by no means proven, so we should test this (it would certainly be an interesting exercise!). However, even if it turns out that there are significant problems here, we still care about the other bits of the stack — there’s lots of potentially-latency-introducing churn there and the risk of regression in our own code is probably higher than it is elsewhere since it changes so much.
Last year, I wrote up a tool called Orangutan that can directly inject input events into an input device on Android or FirefoxOS. It seemed like a fairly straightforward extension of the tool to output timestamps when these events were registered. It was. Then, by synchronizing the time between the device and the machine doing the capturing, we can then correlate the input timestamps to events. To help visualize what’s going on, I generated this view:
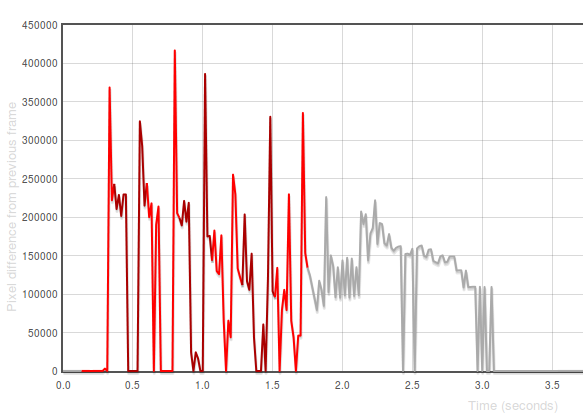
The X axis in that graph represents time. The Y-axis represents the difference between the frame at that time with the previous one in number of pixels. The “red” represents periods in capture when events are ongoing (we use different colours only to
distinguish distinct events). 1
For a first pass at measuring responsiveness, I decided to measure the time between the first event being initiated and there being a significant frame difference (i.e. an observable response to the action). You can see some preliminary results on the eideticker dashboard:
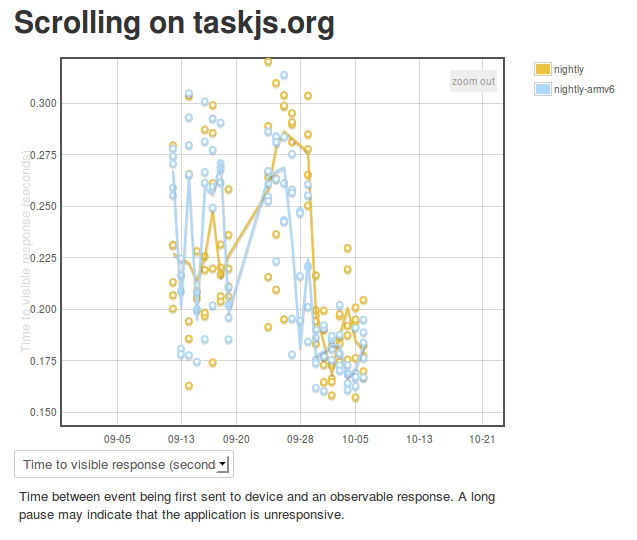
The results seem pretty highly variable at first because I was synchronizing time between the device and an external ntp server, rather than the host machine. I believe this is now fixed, hopefully giving us results that will indicate when regressions occur. As time goes by, we may want to craft some special eideticker tests for responsiveness specifically (e.g. a site where there is heavy javascript background processing).
1 Incidentally, these “frame difference” graphs are also quite useful for understanding where and how application startup has regressed in Fennec — try opening these two startup views side-by-side (before/after a large regression) and spot the difference: [1] and [2])