Eideticker for FirefoxOS: Becoming more useful
Mar 9th, 2014
[ For more information on the Eideticker software I’m referring to, see this entry ]
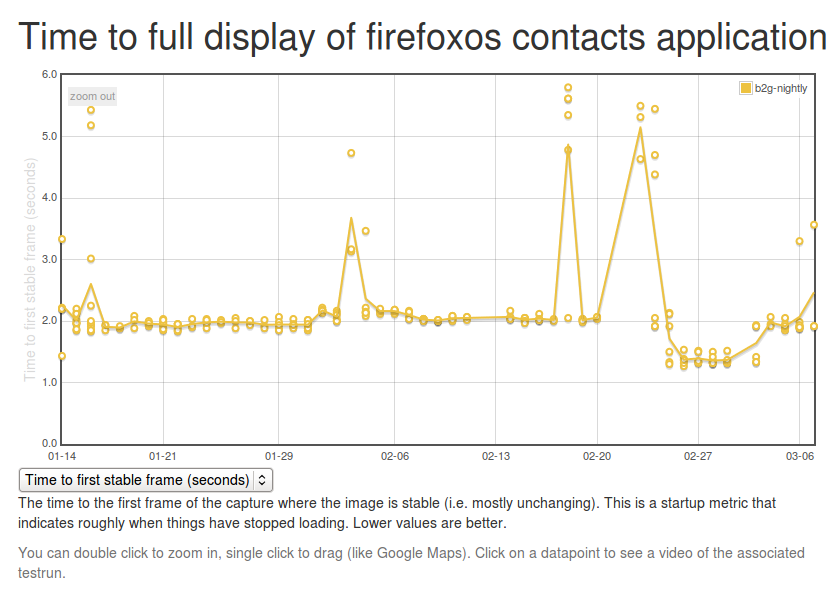
Time for a long overdue eideticker-for-firefoxos update. Last time we were here (almost 5 months ago! man time flies), I was discussing methodologies for measuring startup performance. Since then, Dave Hunt and myself have been doing lots of work to make Eideticker more robust and useful. Notably, we now have a setup in London running a suite of Eideticker tests on the latest version of FirefoxOS on the Inari on a daily basis, reporting to http://eideticker.mozilla.org/b2g.
There were more than a few false starts with and some of the earlier data is not to be entirely trusted but it now seems to be chugging along nicely, hopefully providing startup numbers that provide a useful counterpoint to the datazilla startup numbers we’ve already been collecting for some time. There still seem to be some minor problems, but in general I am becoming more and more confident in it as time goes on.
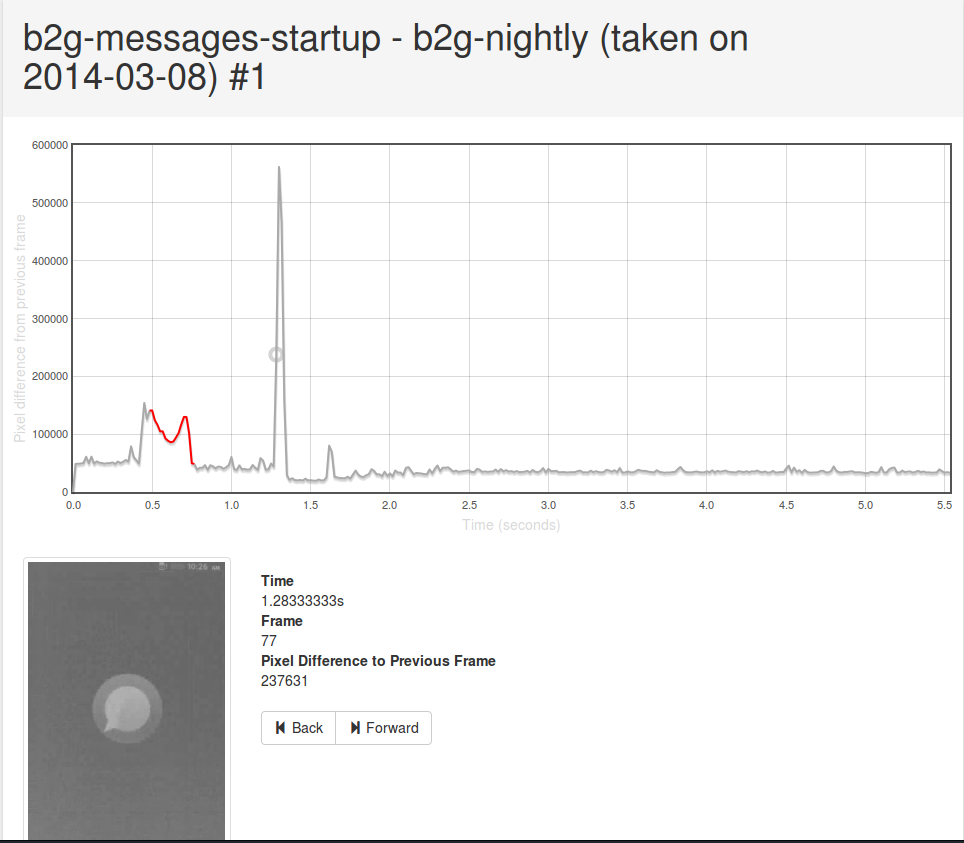
One feature that I am particularly proud of is the detail view, which enables you to see frame-by-frame what’s going on. Click on any datapoint on the graph, then open up the view that gives an account of what eideticker is measuring. Hover over the graph and you can see what the video looks like at any point in the capture. This not only lets you know that something regressed, but how. For example, in the messages app, you can scan through this view to see exactly when the first message shows up, and what exact state the application is in when Eideticker says it’s “done loading”.
(apologies for the low quality of the video — should be fixed with this bug next week)
As it turns out, this view has also proven to be particularly useful when working with the new entropy measurements in Eideticker which I’ve been using to measure checkerboarding (redraw delay) on FirefoxOS. More on that next week.

