Perfherder update: Summary series drilldown
Mar 27th, 2015
Just wanted to give another quick Perfherder update. Since the last time, I’ve added summary series (which is what GraphServer shows you), so we now have (in theory) the best of both worlds when it comes to Talos data: aggregate summaries of the various suites we run (tp5, tart, etc), with the ability to dig into individual results as needed. This kind of analysis wasn’t possible with Graphserver and I’m hopeful this will be helpful in tracking down the root causes of Talos regressions more effectively.
Let’s give an example of where this might be useful by showing how it can highlight problems. Recently we tracked a regression in the Customization Animation Tests (CART) suite from the commit in bug 1128354. Using Mishra Vikas‘s new “highlight revision mode” in Perfherder (combined with the revision hash when the regression was pushed to inbound), we can quickly zero in on the location of it:
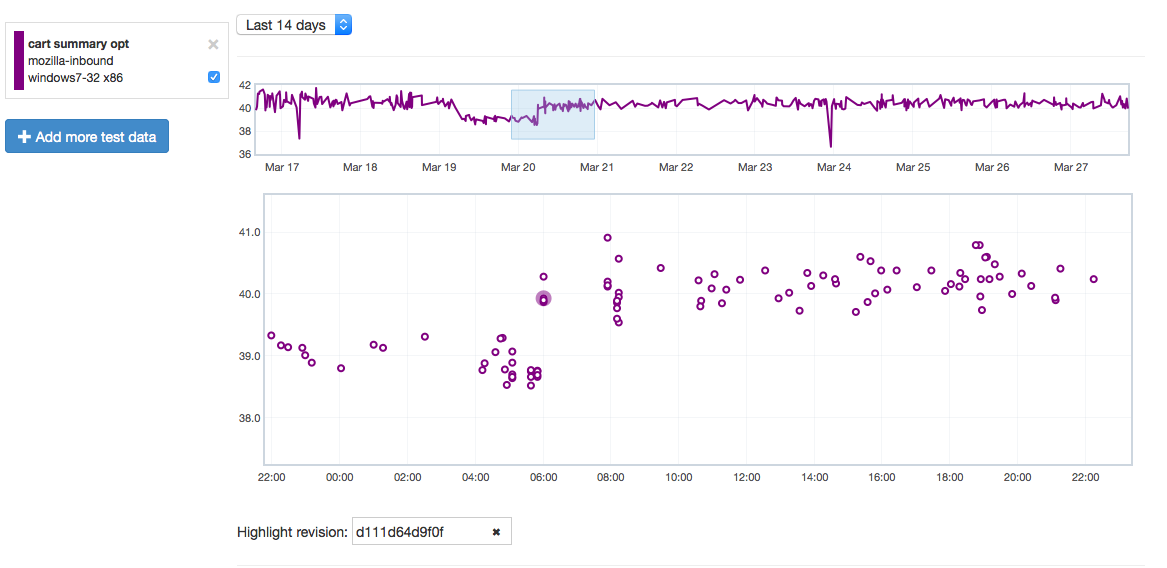
It does indeed look like things ticked up after this commit for the CART suite, but why? By clicking on the datapoint, you can open up a subtest summary view beneath the graph:
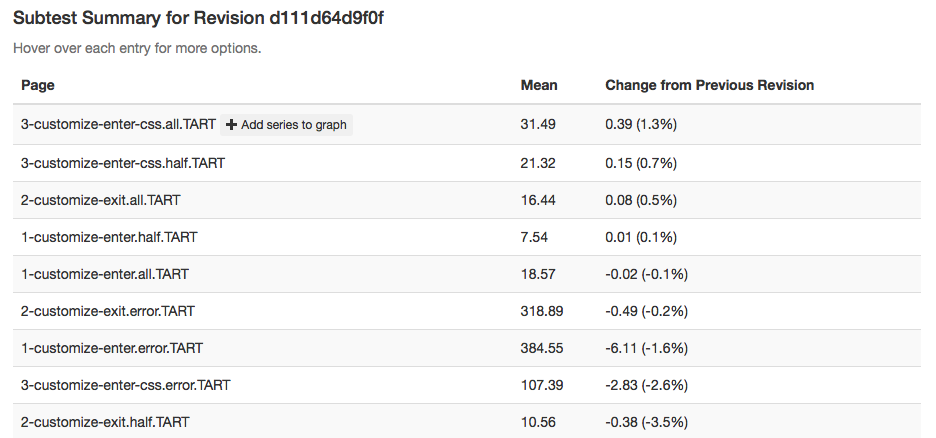
We see here that it looks like the 3-customize-enter-css.all.TART entry ticked up a bunch. The related test 3-customize-enter-css.half.TART ticked up a bit too. The changes elsewhere look minimal. But is that a trend that holds across the data over time? We can add some of the relevant subtests to the overall graph view to get a closer look:
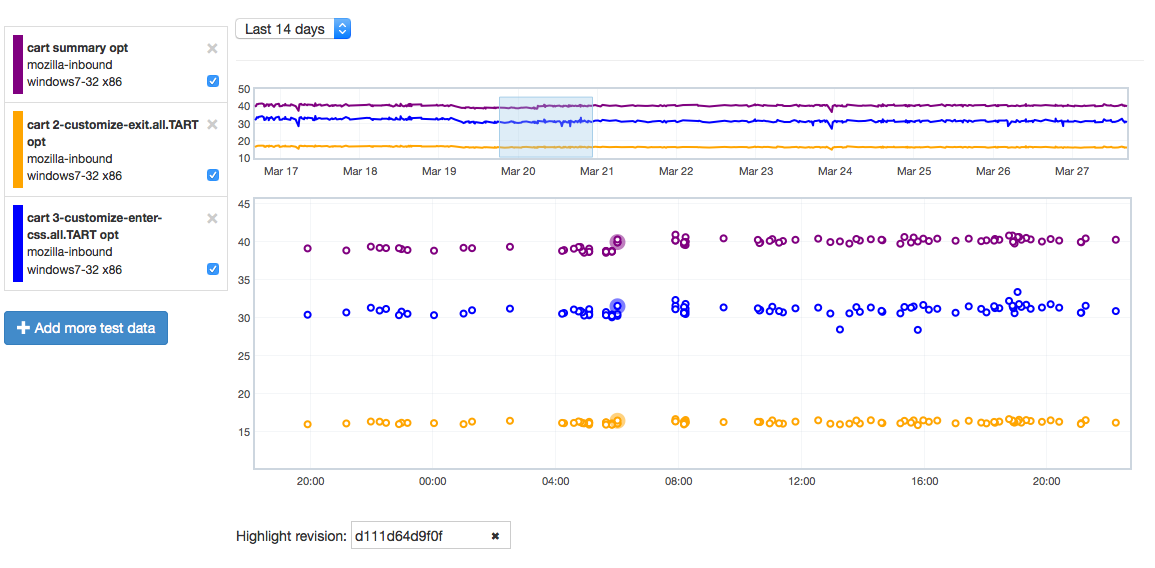
As is hopefully obvious, this confirms that the affected subtest continues to hold its higher value while another test just bounces around more or less in the range it was before.
Hope people find this useful! If you want to play with this yourself, you can access the perfherder UI at http://treeherder.mozilla.org/perf.html.