This Week in Glean: mozregression telemetry (part 2)
May 8th, 2020
(“This Week in Glean” is a series of blog posts that the Glean Team at Mozilla is using to try to communicate better about our work. They could be release notes, documentation, hopes, dreams, or whatever: so long as it is inspired by Glean. You can find an index of all TWiG posts online.)
This is a special guest post by non-Glean-team member William Lachance!
This is a continuation of an exploration of adding Glean-based telemetry to a python application, in this case mozregression, a tool for automatically finding the source of Firefox regressions (breakage).
When we left off last time, we had written some test scripts and verified that the data was visible in the debug viewer.
Adding Telemetry to mozregression itself
In many ways, this is pretty similar to what I did inside the sample application: the only significant difference is that these are shipped inside a Python application that is meant to be be installable via pip. This means we need to specify the pings.yaml and metrics.yaml (located inside the mozregression subirectory) as package data inside setup.py:
setup(
    name="mozregression",
    ...
    package_data={"mozregression": ["*.yaml"]},
    ...
)
There were also a number of Glean SDK enhancements which we determined were necessary. Most notably, Michael Droettboom added 32-bit Windows wheels to the Glean SDK, which we need to make building the mozregression GUI on Windows possible. In addition, some minor changes needed to be made to Glean’s behaviour for it to work correctly with a command-line tool like mozregression — for example, Glean used to assume that Telemetry would always be disabled via a GUI action so that it would send a deletion ping, but this would obviously not work in an application like mozregression where there is only a configuration file — so for this case, Glean needed to be modified to check if it had been disabled between runs.
Many thanks to Mike (and others on the Glean team) for so patiently listening to my concerns and modifying Glean accordingly.
Getting Data Review
At Mozilla, we don’t just allow random engineers like myself to start collecting data in a product that we ship (even a semi-internal like mozregression). We have a process, overseen by Data Stewards to make sure the information we gather is actually answering important questions and doesn’t unnecessarily collect personally identifiable information (e.g. email addresses).
You can see the specifics of how this worked out in the case of mozregression in bug 1581647.
Documentation
Glean has some fantastic utilities for generating markdown-based documentation on what information is being collected, which I have made available on GitHub:
https://github.com/mozilla/mozregression/blob/master/docs/glean/metrics.md
The generation of this documentation is hooked up to mozregression’s continuous integration, so we can sure it’s up to date.
I also added a quick note to mozregression’s web site describing the feature, along with (very importantly) instructions on how to turn it off.
Enabling Data Ingestion
Once a Glean-based project has passed data review, getting our infrastructure to ingest it is pretty straightforward. Normally we would suggest just filing a bug and let us (the data team) handle the details, but since I’m on that team, I’m going to go a (little bit) of detail into how the sausage is made.
Behind the scenes, we have a collection of ETL (extract-transform-load) scripts in the probe-scraper repository which are responsible for parsing the ping and probe metadata files that I added to mozregression in the step above and then automatically creating BigQuery tables and updating our ingestion machinery to insert data passed to us there.
There’s quite a bit of complicated machinery being the scenes to make this all work, but since it’s already in place, adding a new thing like this is relatively simple. The changeset I submitted as part of a pull request to probe-scraper was all of 9 lines long:
diff --git a/repositories.yaml b/repositories.yaml
index dffcccf..6212e55 100644
--- a/repositories.yaml
+++ b/repositories.yaml
@@ -239,3 +239,12 @@ firefox-android-release:
     - org.mozilla.components:browser-engine-gecko-beta
     - org.mozilla.appservices:logins
     - org.mozilla.components:support-migration
+mozregression:
+  app_id: org-mozilla-mozregression
+  notification_emails:
+    - wlachance@mozilla.com
+  url: 'https://github.com/mozilla/mozregression'
+  metrics_files:
+    - 'mozregression/metrics.yaml'
+  ping_files:
+    - 'mozregression/pings.yaml'
A Pretty Graph
With the probe scraper change merged and deployed, we can now start querying! A number of tables are automatically created according to the schema outlined above: notably “live” and “stable” tables corresponding to the usage ping. Using sql.telemetry.mozilla.org we can start exploring what’s out there. Here’s a quick query I wrote up:
SELECT DATE(submission_timestamp) AS date,
       metrics.string.usage_variant AS variant,
       count(*),
FROM `moz-fx-data-shared-prod`.org_mozilla_mozregression_stable.usage_v1
WHERE DATE(submission_timestamp) >= '2020-04-14'
  AND client_info.app_display_version NOT LIKE '%.dev%'
GROUP BY date, variant;
… which generates a chart like this:
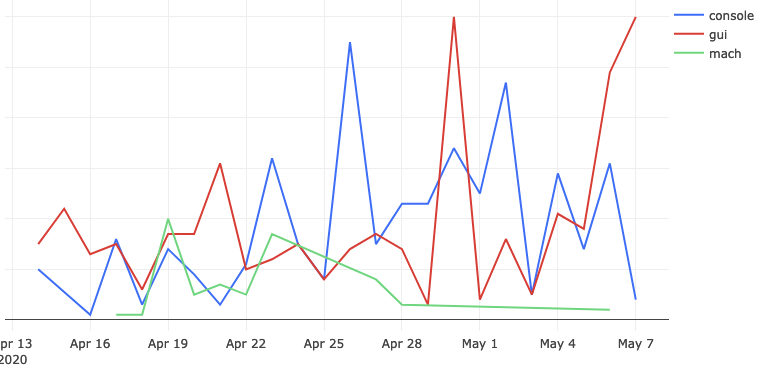
This chart represents the absolute volume of mozregression usage since April 14th 2020 (around the time when we first released a version of mozregression with Glean telemetry), grouped by mozregression “variant” (GUI, console, and mach) and date - you can see that (unsurprisingly?) the GUI has the highest usage. I’ll talk about this more in an upcoming installment, speaking of…
Next Steps
We’re not done yet! Next time, we’ll look into making a public-facing dashboard demonstrating these results and making an aggregated version of the mozregression telemetry data publicly accessible to researchers and the general public. If we’re lucky, there might even be a bit of data science. Stay tuned!