It’s all about the entropy
Mar 14th, 2014
[ For more information on the Eideticker software I’m referring to, see this entry ]
So recently I’ve been exploring new and different methods of measuring things that we care about on FirefoxOS — like startup time or amount of checkerboarding. With Android, where we have a mostly clean signal, these measurements were pretty straightforward. Want to measure startup times? Just capture a video of Firefox starting, then compare the frames pixel by pixel to see how much they differ. When the pixels aren’t that different anymore, we’re “done”. Likewise, to measure checkerboarding we just calculated the areas of the screen where things were not completely drawn yet, frame-by-frame.
On FirefoxOS, where we’re using a camera to measure these things, it has not been so simple. I’ve already discussed this with respect to startup time in a previous post. One of the ideas I talk about there is “entropy” (or the amount of unique information in the frame). It turns out that this is a pretty deep concept, and is useful for even more things than I thought of at the time. Since this is probably a concept that people are going to be thinking/talking about for a while, it’s worth going into a little more detail about the math behind it.
The wikipedia article on information theoretic entropy is a pretty good introduction. You should read it. It all boils down to this formula:
![]()
You can see this section of the wikipedia article (and the various articles that it links to) if you want to break down where that comes from, but the short answer is that given a set of random samples, the more different values there are, the higher the entropy will be. Look at it from a probabilistic point of view: if you take a random set of data and want to make predictions on what future data will look like. If it is highly random, it will be harder to predict what comes next. Conversely, if it is more uniform it is easier to predict what form it will take.
Another, possibly more accessible way of thinking about the entropy of a given set of data would be “how well would it compress?”. For example, a bitmap image with nothing but black in it could compress very well as there’s essentially only 1 piece of unique information in it repeated many times — the black pixel. On the other hand, a bitmap image of completely randomly generated pixels would probably compress very badly, as almost every pixel represents several dimensions of unique information. For all the statistics terminology, etc. that’s all the above formula is trying to say.
So we have a model of entropy, now what? For Eideticker, the question is — how can we break the frame data we’re gathering down into a form that’s amenable to this kind of analysis? The approach I took (on the recommendation of this article) was to create a histogram with 256 bins (representing the number of distinct possibilities in a black & white capture) out of all the pixels in the frame, then run the formula over that. The exact function I wound up using looks like this:
def _get_frame_entropy((i, capture, sobelized)):
    frame = capture.get_frame(i, True).astype('float')
    if sobelized:
        frame = ndimage.median_filter(frame, 3)

        dx = ndimage.sobel(frame, 0)  # horizontal derivative
        dy = ndimage.sobel(frame, 1)  # vertical derivative
        frame = numpy.hypot(dx, dy)  # magnitude
        frame *= 255.0 / numpy.max(frame)  # normalize (Q&D)

    histogram = numpy.histogram(frame, bins=256)[0]
    histogram_length = sum(histogram)
    samples_probability = [float(h) / histogram_length for h in histogram]
    entropy = -sum([p * math.log(p, 2) for p in samples_probability if p != 0])

return entropyThe “sobelized” bit allows us to optionally convolve the frame with a sobel filter before running the entropy calculation, which removes most of the data in the capture except for the edges. This is especially useful for FirefoxOS, where the signal has quite a bit of random noise from ambient lighting that artificially inflate the entropy values even in places where there is little actual “information”.
This type of transformation often reveals very interesting information about what’s going on in an eideticker test. For example, take this video of the user panning down in the contacts app:
If you graph the entropies of the frame of the capture using the formula above you, you get a graph like this:
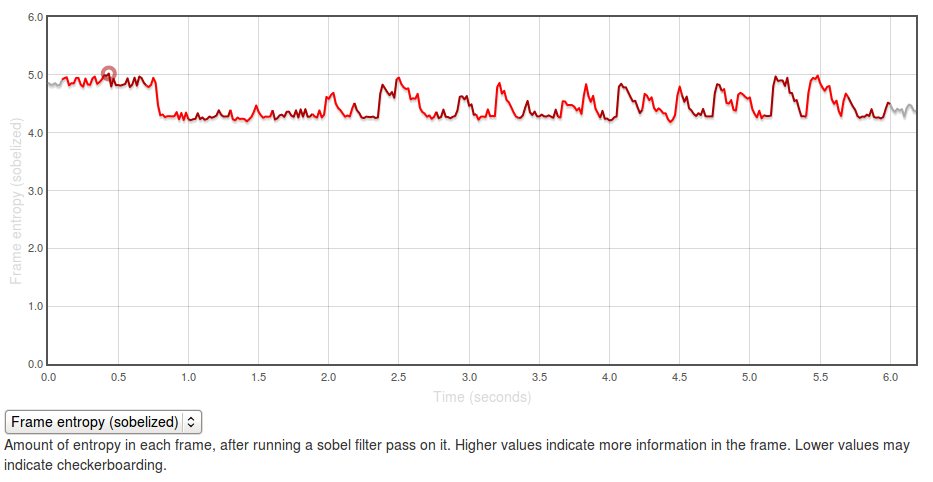
The Y axis represents entropy, as calculated by the code above. There is no inherently “right” value for this — it all depends on the application you’re testing and what you expect to see displayed on the screen. In general though, higher values are better as it indicates more frames of the capture are “complete”.
The region at the beginning where it is at about 5.0 represents the contacts app with a set of contacts fully displayed (at startup). The “flat” regions where the entropy is at roughly 4.25? Those are the areas where the app is “checkerboarding” (blanking out waiting for graphics or layout engine to draw contact information). Click through to the original and swipe over the graph to see what I mean.
It’s easy to see what a hypothetical ideal end state would be for this capture: a graph with a smooth entropy of about 5.0 (similar to the start state, where all contacts are fully drawn in). We can track our progress towards this goal (or our deviation from it), by watching the eideticker b2g dashboard and seeing if the summation of the entropy values for frames over the entire test increases or decreases over time. If we see it generally increase, that probably means we’re seeing less checkerboarding in the capture. If we see it decrease, that might mean we’re now seeing checkerboarding where we weren’t before.
It’s too early to say for sure, but over the past few days the trend has been positive:
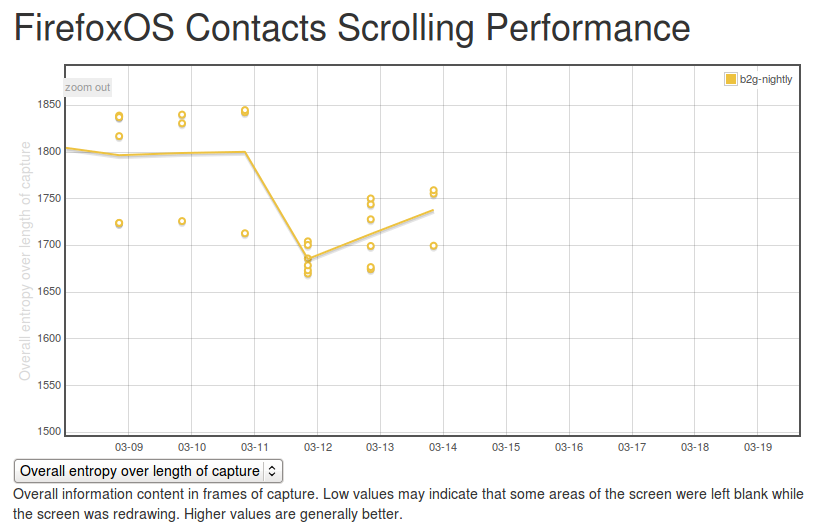
(note that there were some problems in the way the tests were being run before, so results before the 12th should not be considered valid)
So one concept, at least two relevant metrics we can measure with it (startup time and checkerboarding). Are there any more? Almost certainly, let’s find them!