Historically at Mozilla, we’ve had a bunch of different systems running to benchmark Firefox’s performance. The two most broadly-scoped are Talos (which runs as part of our build process, and emphasizes common real-world use cases, like page loading) and Are We Fast Yet (which runs seperately, and emphasizes JavaScript performance and benchmarks).
As many of you know, most of my focus over the last year-and-a-bit has been developing a system called Perfherder, which aims to make monitoring and acting on performance data easier. A great introduction to Perfherder is my project of the month post.
The initial focus of Perfherder has been Talos, which is deeply integrated into our automation and also maintained by Engineering Productivity (my group). However, the intention was always to allow anyone in the Mozilla community to submit performance data for Firefox and sheriff it, much like Treeherder has supported the submission of test result data from third parties (e.g. autophone, Firefox UI tests). There are more commonalities than differences in how we do performance sheriffing with Are We Fast Yet (which currently has its own web interface) and Perfherder, so it made sense to see if we could pool resources.
So, over the last couple of months, Joel Maher and I have been in discussions with Hannes Verschore, current maintainer of Are We Fast Yet (AWFY) to see what could be done. It looks like it is possible for Perfherder to provide most of what AWFY needs, though there are a few exceptions. I thought for the benefit of others, it might be useful to outline what’s done, what’s coming next, and what might not be implemented (at least not any time soon).
What’s done
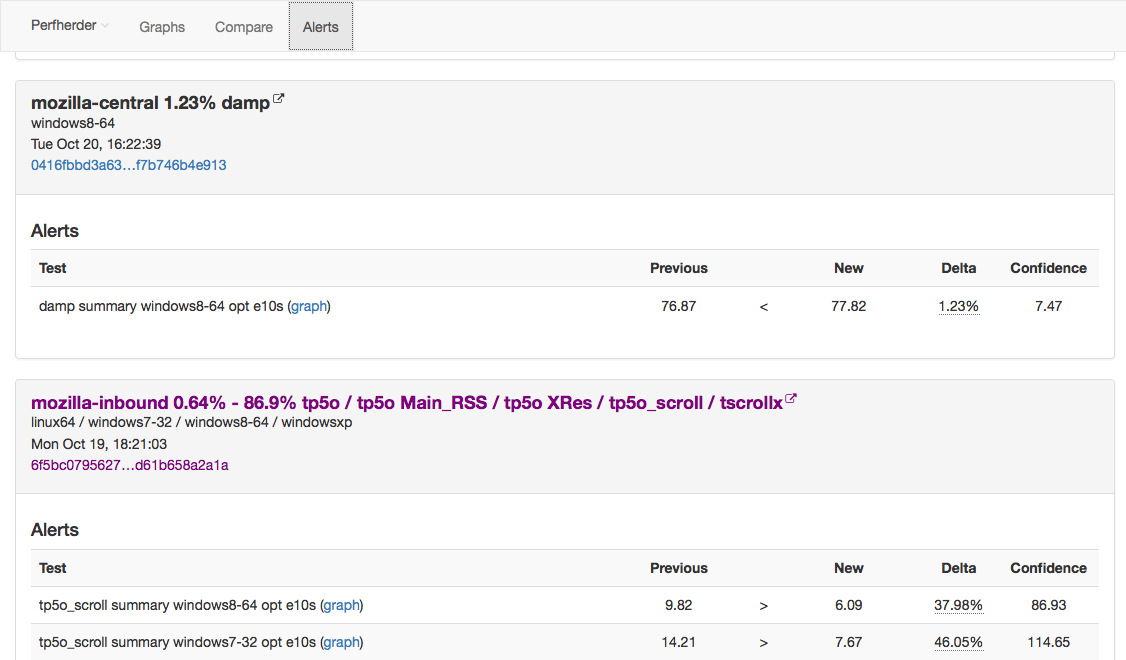
- Get AWFY submitting data to Perfherder and allow it to be sheriffed seperately from Talos. This is working on treeherder stage, and you can already examine the alert data.
What’s in progress (or in the near-term pipeline)
- Allow custom alerting behaviour (bug 1254595). For example, we want to alert on subtests for AWFY while still summarizing the results. This is something we don’t currently support.
- Allow creating an alert manually (bug 1260791). Sadly, our regression detection algorithm is not perfect. AWFY already supports this, we should too. This is something we also want for Talos.
- Make regression-filing templates non-talos-specific (bug 1260805). Currently we have a convenience template for filing bugs for performance regressions, but this is currently specific to various things about Talos (job running instructions, links to documentation, etc.). We should make it configurable so other projects like AWFY can take advantage of this functionality.
Under consideration
- Some kind of support for bisecting a push to figure out which patch caused a regression. AWFY currently supports this, but it’s a fairly difficult thing to add to Perfherder (much of which is built upon Treeherder’s per-push result model). Maybe this is something we should do, but it would be a significant amount of effort.
- Proprietary benchmarks: AWFY runs one benchmark the results for which we can’t make public. Adding “private” jobs or results to Treeherder is likely a big can of worms, but it might be something we want to do eventually.
Probably won’t fix
- Supporting comparative measurements between Firefox and other browsers. This is an important task, but doesn’t really fit into the model of Perfherder, which is intimately tied to the revision data associated with Firefox. To do this would require detailed tracking of Chrome on the same basis, and I don’t think that’s really a place where we want to go. We should definitely monitor for general trends, but I think that is best done with a seperate system.
[ originally posted on mozilla.dev.platform ]
Hello from Platform Engineering Operations! Once a month we highlight one of our projects to help the Mozilla community discover a useful tool or an interesting contribution opportunity.
This month’s project is Perfherder!
What is Perfherder?
Perfherder is a generic system for visualizing and analyzing performance data produced by the many automated tests we run here at Mozilla (such as Talos, “Are we fast yet?” or “Are we slim yet?”). The chief goal of the project is to make sure that performance of Firefox gets better, not worse over time. It does this by:
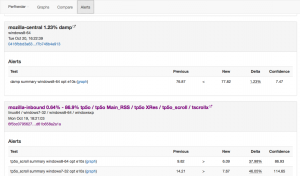
- Tracking the performance generated by our automated tests, allowing them to be visualized on a graph.
- Providing a sheriffing dashboard which allows for incoming alerts of performance regressions to be annotated and triaged - bugs can be filed based on a template and their resolution status can be tracked.
In addition to its own user interface, Perfherder also provides an API on the backend that other people can use to build custom performance visualizations and dashboards. For example, the metrics group has been working on a set of release quality indices for performance based on Perfherder data:
https://metrics.mozilla.com/quality-indices/
How it works
Perfherder is part of Treeherder, building on that project’s existing support for tracking revision and test job information. Like the rest of Treeherder, Perfherder’s backend is written in Python, using the Django web framework. The user interface is written as an AngularJS application.
Learning more
For more information on Perfherder than you ever wanted to know, please see the wiki page:
https://wiki.mozilla.org/EngineeringProductivity/Projects/Perfherder
Can I contribute?
Yes! We have had some fantastic contributions from the community to Perfherder, and are always looking for more. This is a great way to help developers make Firefox faster (or use less memory). The core of Perfherder is relatively small, so this is a great chance to learn either Django or Angular if you have a small amount of Python and/or JavaScript experience.
We have set aside a set of bugs that are suitable for getting started here:
https://bugzilla.mozilla.org/buglist.cgi?list_id=12722722&resolution=---&status_whiteboard_type=allwordssubstr&query_format=advanced&status_whiteboard=perfherder-starter-bug
For more information on contributing to Perfherder, please see the contribution section of the above wiki page:
https://wiki.mozilla.org/EngineeringProductivity/Projects/Perfherder#Contribution
It’s a small thing, but I submitted a patch to trychooser last week which adds a tooltip indicating the actual Talos tests that are run as part of the various jobs that you can schedule as part of a try push. It’s in production as of now:
Previously, the only way to do this was to dig into the actual buildbot code, which was more than a little annoying.
If you think your patch might have a good chance of regressing performance, please do run the Talos tests before you check in. It’s much less work for all of us when these things are caught before integration and back outs are no fun for anyone. We really need better documentation for this stuff, but meanwhile if you need help with this, please ask in the #perf channel on irc.mozilla.org
I was saddened to find out last week that the person who introduced me to Zen practice three years ago, Albert Low, has passed away. Albert was the teacher of the Montreal Zen Center, which I was a member of for a brief period (6 months) in 2014 before I moved to Toronto and started practicing at the center here.
Albert’s instruction was the gateway to a practice that has had a profound impact on my life. More than anything, he helped me understand Zen as something that one could incorporate directly into daily life. I will remain forever grateful.
As my blog goes to github pages, so do my other side projects. I just moved nixi, my bikestation finder project, to github pages. Its new location:
http://wlach.github.io/nixi
I opted not to move over the domain: it would have cost extra money, time and hassle and I couldn’t justify it for the very, very small number of people that still use this site (yes, there are a few, including myself!). For now, nixi.ca will redirect to the github pages site until I decommision my linode server, probably at the end of January (end of Feburary at the latest).
This transition brings some other changes with it:
- Now using the citybik.es API directly, instead of proxing through an intermediary server. This was necessitated by the switch to github pages, but I suspect this will be more reliable than what we were doing before. Thanks citybik.es!
- Removed all analytics and facebook integration. As with the domain, it didn’t seem worth bringing over. Also, it’s nice to give people at least marginally more privacy than they had before where possible.
I still think nixi is worlds more usable than most bikesharing maps, even if it’s not an actively maintained project of mine any more. Here’s hoping it lasts many more years in its new incarnation.
After thinking about doing it for longer than I’d like to admit, I finally bit the bullet and decided to migrate away from WordPress, towards a markdown-based blog generator (Frog in this case). All the content from the old blog is coming with me (thanks mostly to WordPress’s jekyll exporter plugin).
While WordPress is a pretty impressive piece of software, it isn’t the ideal platform for the sorts of things I want to express. It’s a reasonable tool for publishing straight longform essays, but my more interesting posts tend to also include images, code and examples, and sometimes even math. Making those look reasonable involved a bunch of manual effort and the end result wasn’t particularly great. I was particularly disappointed in its (lack of) support for inline code snippits.
Perhaps this set of problems is resolvable by installing the right set of plugins. Perhaps. But therein lies my second problem with WordPress: it’s big, complex piece of software written in PHP, and I’m frankly tired of figuring out how to (barely) make it do the things I need it to do, while half-worrying that the new fancy WPAwesome plugin I’m installing is malware.
As I’ve grown older, I’m increasingly realizing the limits to what I have the time (and energy) to accomplish. While “Making WordPress do the things I want” is something I could continue working on, it would come at the expense of other things that I find more rewarding, whether that be meditating, brushing up on deep learning, or even just writing more stuff here. I don’t expect this new blog to be maintenance free, but it should be an order of magnitude simpler using Frog, which is narrowly focused on my rather technical use case and specifically has great support for inline code, images, and math.
Along the same lines, I’m completely tired of maintaining the Linux server that my blog ran on. Registering domains and setting up my own HTTP server seemed like an interesting diversion in 2009, when cheap Linux VPSes were first starting to appear on the market. These days… well, not so much. It’s a minor, though not completely trivial, expense ($10 USD/mo.) but more importantly it’s a sink of my time to install security patches, make sure things are to up to date, etc. It feels like I’m solving the same (boring) set of problems over and over, with no real payoff. Time to move on.
Thus, this blog (along with my other hosted projects, like NIXI and meditation) will be moving to github pages. Initially I had the worry that this move would mean that I wouldn’t be “in control of my own destiny”, but on reflection I don’t think that’s true. The fact that my blog is basically a giant git repository should make switching hosting providers quite easy if Github becomes unsatisfactory for whatever reason.
Indeed, even the custom domain (wrla.ch) seems unnecessary at this point. Although github pages does support them, I’m just not seeing the value in keeping it around. What purpose does it really serve? All a custom personal domain really says to me is that the person had the time/money to register it. Is that something that someone in my position really needs to communicate? And if I don’t need it, why continue with the unnecessary expense and hassle?
Perhaps the only legitimate reason to keep the domain would be continuity for readers (i.e. there’s a link or two in their browser history), but I don’t think that’s a big deal in my case. Yes, people might occasionally be thrown off and have to use Yahoo/Google to re-find something… but for the type of content I host, I don’t think that will take too much collective time. In the grand stream of things, I’m pretty small potatoes. Most of my traffic just comes through planet.mozilla.org, and that’s easy to redirect automatically.
So though I’ll be keeping around wrla.ch for a little bit to give people time to migrate their links (it doesn’t expire until the end of February 2016), it will also be going away. Please redirect your feed readers to wlach.github.io.
Now, onto more interesting things!
In addition to the database refactoring I mentioned a few weeks ago, some cool stuff has been going into Perfherder lately.
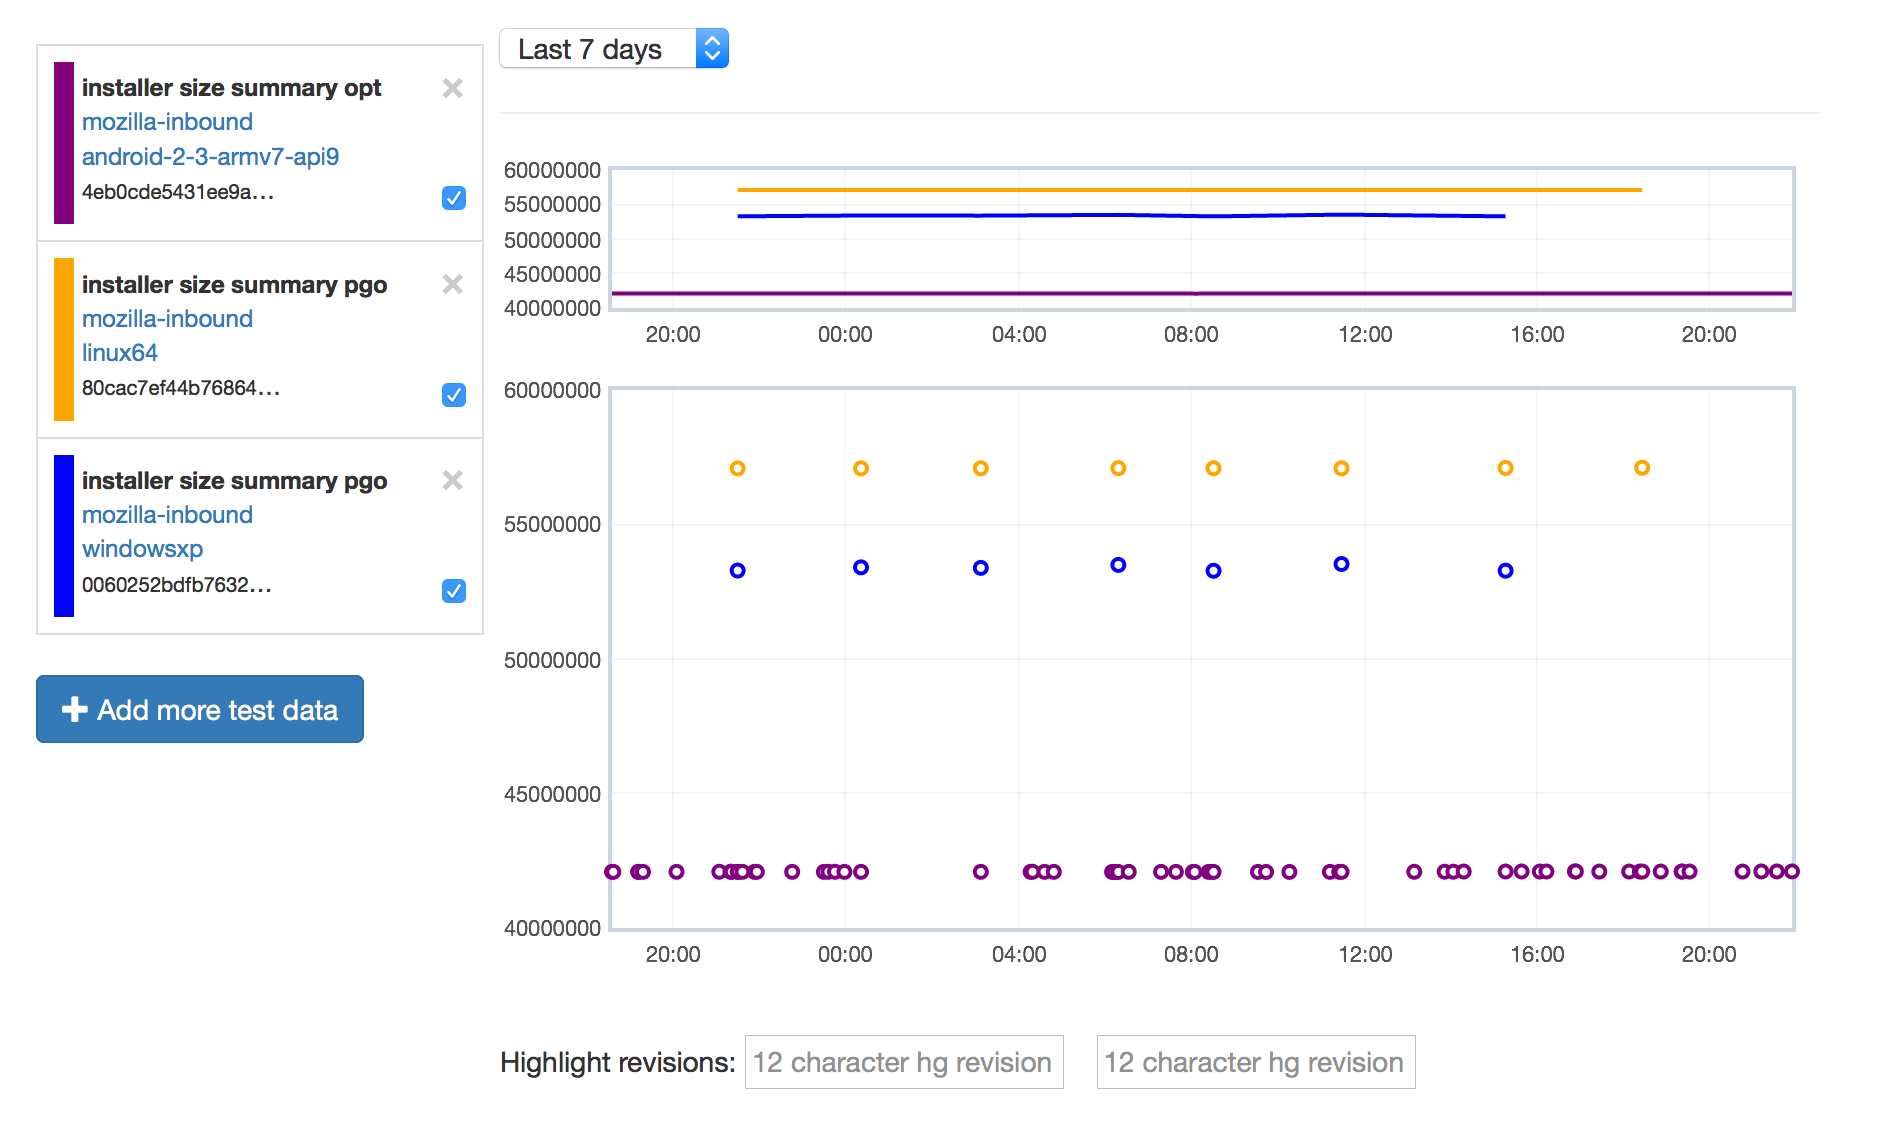
Tracking installer size
Perfherder is now tracking the size of the Firefox installer for the various platforms we support (bug 1149164). I originally only intended to track Android .APK size (on request from the mobile team), but installer sizes for other platforms came along for the ride. I don’t think anyone will complain.
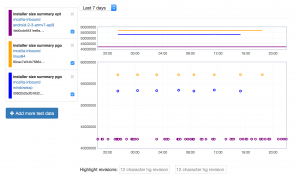
link
Just as exciting to me as the feature itself is how it’s implemented: I added a log parser to treeherder which just picks up a line called “PERFHERDER_DATA” in the logs with specially formatted JSON data, and then automatically stores whatever metrics are in there in the database (platform, options, etc. are automatically determined). For example, on Linux:
PERFHERDER_DATA: {"framework": {"name": "build_metrics"}, "suites": [{"subtests": [{"name": "libxul.so", "value": 99030741}], "name": "installer size", "value": 55555785}]}
This should make it super easy for people to add their own metrics to Perfherder for build and test jobs. We’ll have to be somewhat careful about how we do this (we don’t want to add thousands of new series with irrelevant / inconsistent data) but I think there’s lots of potential here to be able to track things we care about on a per-commit basis. Maybe build times (?).
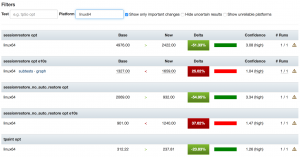
More compare view improvements
I added filtering to the Perfherder compare view and added back links to the graphs view. Filtering should make it easier to highlight particular problematic tests in bug reports, etc. The graphs links shouldn’t really be necessary, but unfortunately are due to the unreliability of our data — sometimes you can only see if a particular difference between two revisions is worth paying attention to in the context of the numbers over the last several weeks.
Miscellaneous
Even after the summer of contribution has ended, Mike Ling continues to do great work. Looking at the commit log over the past few weeks, he’s been responsible for the following fixes and improvements:
- Bug 1218825: Can zoom in on perfherder graphs by selecting the main view
- Bug 1207309: Disable ‘<’ button in test chooser if no test selected
- Bug 1210503 : Include non-summary tests in main comparison view
- Bug 1153956 : Persist the selected revision in the url on perfherder (based on earlier work by Akhilesh Pillai)
Next up
My main goal for this quarter is to create a fully functional interface for actually sheriffing performance regressions, to replace alertmanager. Work on this has been going well. More soon.
I spent a good chunk of time last quarter redesigning how Perfherder stores its data internally. Here are some notes on this change, for posterity.
Perfherder’s data model is based around two concepts:
- Series signatures: A unique set of properties (platform, test name, suite name, options) that identifies a performance test.
- Series data: A set of measurements for a series signature, indexed by treeherder push and job information.
When it was first written, Perfherder stored the second type of data as a JSON-encoded series in a relational (MySQL) database. That is, instead of storing each datum as a row in the database, we would store sequences of them. The assumption was that for the common case (getting a bunch of data to plot on a graph), this would be faster than fetching a bunch of rows and then encoding them as JSON. Unfortunately this wasn’t really true, and it had some serious drawbacks besides.
First, the approach’s performance was awful when it came time to add new data. To avoid needing to decode or download the full stored series when you wanted to render only a small subset of it, we stored the same series multiple times over various time intervals. For example, we stored the series data for one day, one week: all the way up to one year. You can probably see the problem already: you have to decode and re-encode the same data structure many times for each time interval for every new performance datum you were inserting into the database. The pseudo code looked something like this for each push:
for each platform we're testing talos on:
  for each talos job for the platform:
    for each test suite in the talos job:
      for each subtest in the test suite:
        for each time interval in one year, 90 days, 60 days, ...:
           fetch and decode json series for that time interval from db
           add datapoint to end of series
           re-encode series as json and store in db
Consider that we have some 6 platforms (android, linux64, osx, winxp, win7, win8), 20ish test suites with potentially dozens of subtests and you can see where the problems begin.
In addition to being slow to write, this was also a pig in terms of disk space consumption. The overhead of JSON ("{, }" characters, object properties) really starts to add up when you’re storing millions of performance measurements. We got around this (sort of) by gzipping the contents of these series, but that still left us with gigantic mysql replay logs as we stored the complete “transaction” of replacing each of these series rows thousands of times per day. At one point, we completely ran out of disk space on the treeherder staging instance due to this issue.
Read performance was also often terrible for many common use cases. The original assumption I mentioned above was wrong: rendering points on a graph is only one use case a system like Perfherder has to handle. We also want to be able to get the set of series values associated with two result sets (to render comparison views) or to look up the data associated with a particular job. We were essentially indexing the performance data only on one single dimension (time) which made these other types of operations unnecessarily complex and slow — especially as the data you want to look up ages. For example, to look up a two week old comparison between two pushes, you’d also have to fetch the data for every subsequent push. That’s a lot of unnecessary overhead when you’re rendering a comparison view with 100 or so different performance tests:

So what’s the alternative? It’s actually the most obvious thing: just encode one database row per performance series value and create indexes on each of the properties that we might want to search on (repository, timestamp, job id, push id). Yes, this is a lot of rows (the new database stands at 48 million rows of performance data, and counting) but you know what? MySQL is designed to handle that sort of load. The current performance data table looks like this:
+----------------+------------------+
| Field          | Type             |
+----------------+------------------+
| id             | int(11)          |
| job_id         | int(10) unsigned |
| result_set_id  | int(10) unsigned |
| value          | double           |
| push_timestamp | datetime(6)      |
| repository_id  | int(11)          |
| signature_id   | int(11)          |
+----------------+------------------+
MySQL can store each of these structures very efficiently, I haven’t done the exact calculations, but this is well under 50 bytes per row. Including indexes, the complete set of performance data going back to last year clocks in at 15 gigs. Not bad. And we can examine this data structure across any combination of dimensions we like (push, job, timestamp, repository) making common queries to perfherder very fast.
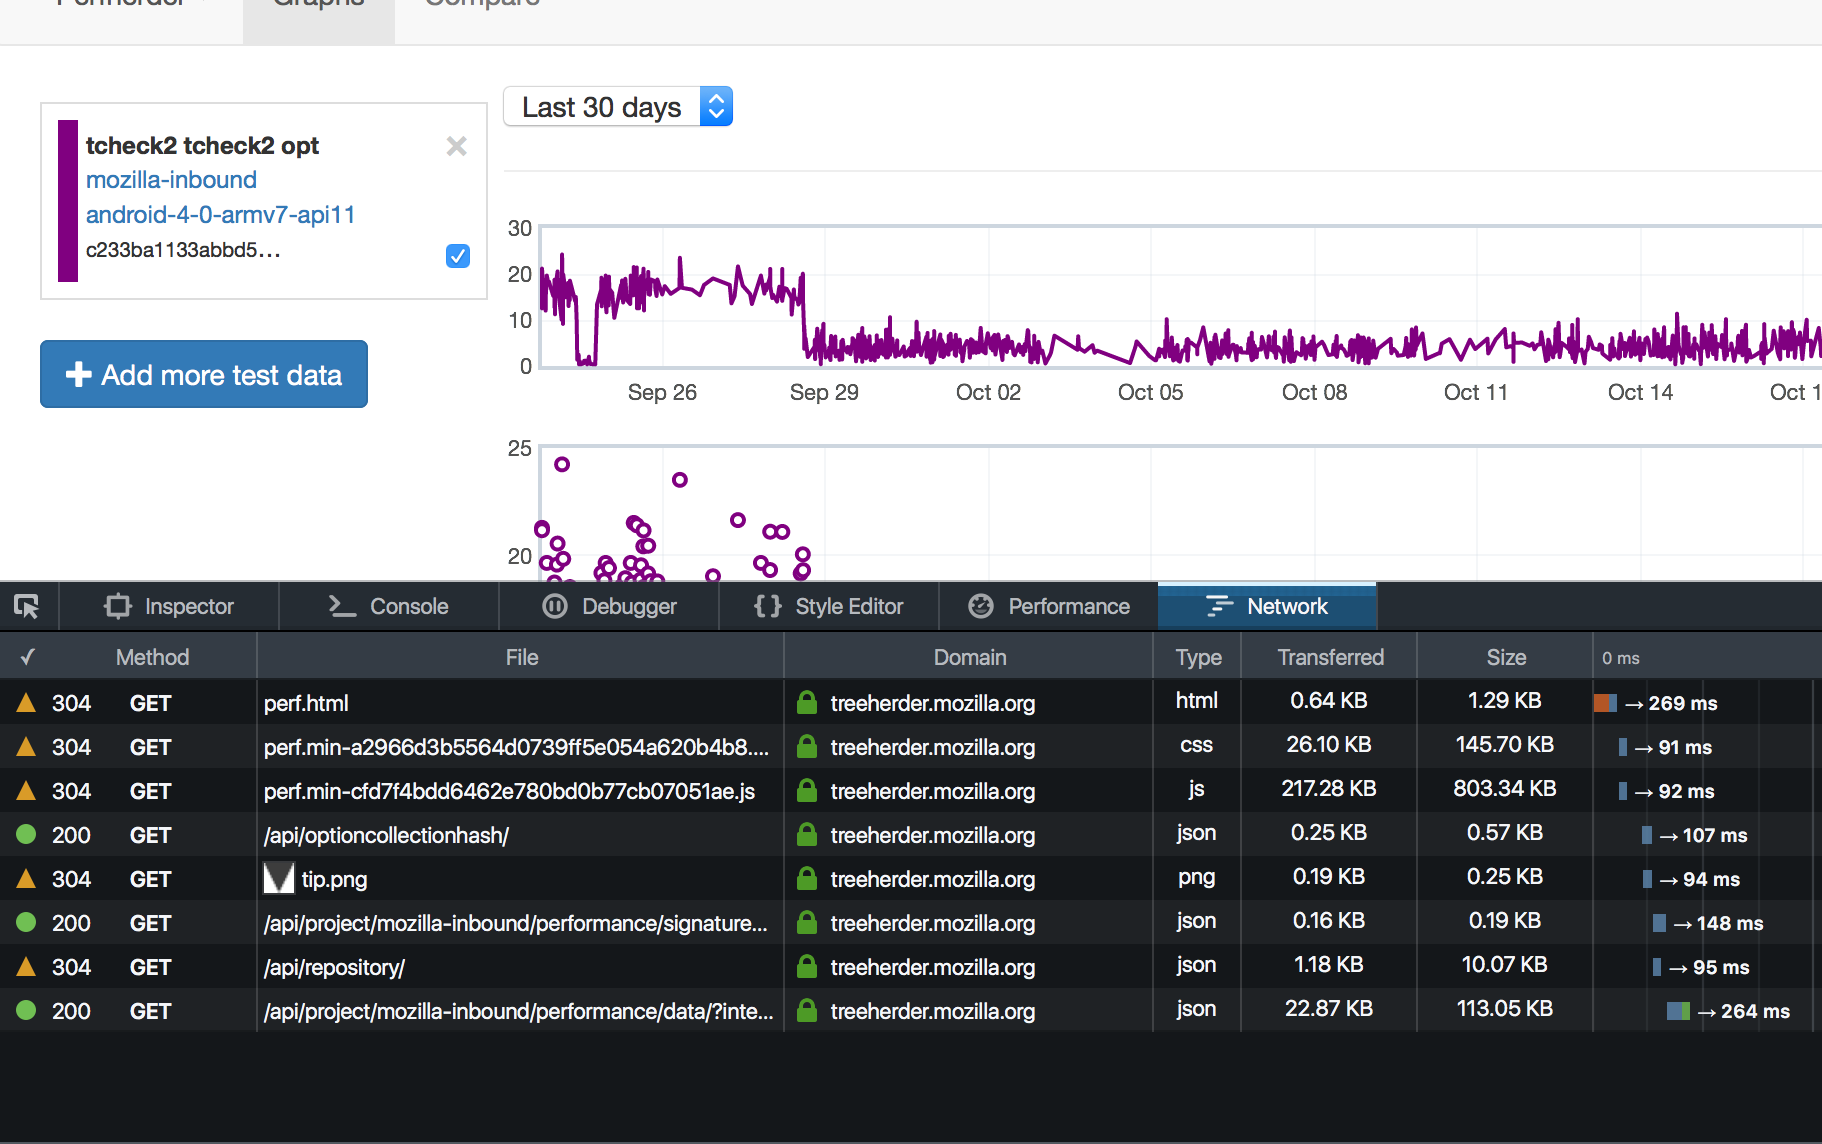
What about the initial assumption, that it would be faster to get a series out of the database if it’s already pre-encoded? Nope, not really. If you have a good index and you’re only fetching the data you need, the overhead of encoding a bunch of database rows to JSON is pretty minor. From my (remote) location in Toronto, I can fetch 30 days of tcheck2 data in 250 ms. Almost certainly most of that is network latency. If the original implementation was faster, it’s not by a significant amount.
Lesson: Sometimes using ancient technologies (SQL) in the most obvious way is the right thing to do. DoTheSimplestThingThatCouldPossiblyWork
A few months ago, Joel Maher announced the Perfherder summer of contribution. We wrapped things up there a few weeks ago, so I guess it’s about time I wrote up a bit about how things went.
As a reminder, the idea of summer of contribution was to give a set of contributors the opportunity to make a substantial contribution to a project we were working on (in this case, the Perfherder performance sheriffing system). We would ask that they sign up to do 5–10 hours of work a week for at least 8 weeks. In return, Joel and myself would make ourselves available as mentors to answer questions about the project whenever they ran into trouble.
To get things rolling, I split off a bunch of work that we felt would be reasonable to do by a contributor into bugs of varying difficulty levels (assigning them the bugzilla whiteboard tag ateam-summer-of-contribution). When someone first expressed interest in working on the project, I’d assign them a relatively easy front end one, just to cover the basics of working with the project (checking out code, making a change, submitting a PR to github). If they made it through that, I’d go on to assign them slightly harder or more complex tasks which dealt with other parts of the codebase, the nature of which depended on what they wanted to learn more about. Perfherder essentially has two components: a data storage and analysis backend written in Python and Django, and a web-based frontend written in JS and Angular. There was (still is) lots to do on both, which gave contributors lots of choice.
This system worked pretty well for attracting people. I think we got at least 5 people interested and contributing useful patches within the first couple of weeks. In general I think onboarding went well. Having good documentation for Perfherder / Treeherder on the wiki certainly helped. We had lots of the usual problems getting people familiar with git and submitting proper pull requests: we use a somewhat clumsy combination of bugzilla and github to manage treeherder issues (we “attach” PRs to bugs as plaintext), which can be a bit offputting to newcomers. But once they got past these issues, things went relatively smoothly.
A few weeks in, I set up a fortnightly skype call for people to join and update status and ask questions. This proved to be quite useful: it let me and Joel articulate the higher-level vision for the project to people (which can be difficult to summarize in text) but more importantly it was also a great opportunity for people to ask questions and raise concerns about the project in a free-form, high-bandwidth environment. In general I’m not a big fan of meetings (especially status report meetings) but I think these were pretty useful. Being able to hear someone else’s voice definitely goes a long way to establishing trust that you just can’t get in the same way over email and irc.
I think our biggest challenge was retention. Due to (understandable) time commitments and constraints only one person (Mike Ling) was really able to stick with it until the end. Still, I’m pretty happy with that success rate: if you stop and think about it, even a 10-hour a week time investment is a fair bit to ask. Some of the people who didn’t quite make it were quite awesome, I hope they come back some day.
—
On that note, a special thanks to Mike Ling for sticking with us this long (he’s still around and doing useful things long after the program ended). He’s done some really fantastic work inside Perfherder and the project is much better for it. I think my two favorite features that he wrote up are the improved test chooser which I talked about a few months ago and a get related platform / branch feature which is a big time saver when trying to determine when a performance regression was first introduced.
I took the time to do a short email interview with him last week. Here’s what he had to say:
- Tell us a little bit about yourself. Where do you live? What is it you do when not contributing to Perfherder?
I’m a postgraduate student of NanChang HangKong university in China whose major is Internet of things. Actually,there are a lot of things I would like to do when I am AFK, play basketball, video game, reading books and listening music, just name it ; )
- How did you find out about the ateam summer of contribution program?
well, I remember when I still a new comer of treeherder, I totally don’t know how to start my contribution. So, I just go to treeherder irc and ask for advice. As I recall, emorley and jfrench talk with me and give me a lot of hits. Then Will (wlach) send me an Email about ateam summer of contribution and perfherder. He told me it’s a good opportunity to learn more about treeherder and how to work like a team! I almost jump out of bed (I receive that email just before get asleep) and reply with YES. Thank you Will!
- What did you find most challenging in the summer of contribution?
I think the most challenging thing is I not only need to know how to code but also need to know how treeherder actually work. It’s a awesome project and there are a ton of things I haven’t heard before (i.e T-test, regression). So I still have a long way to go before I familiar with it.
- What advice would give you to future ateam contributors?
The only thing you need to do is bring your question to irc and ask. Do not hesitate to ask for help if you need it! All the people in here are nice and willing to help. Enjoy it!
Since my last update, we’ve been trucking along with improvements to Perfherder, the project for making Firefox performance sheriffing and analysis easier.
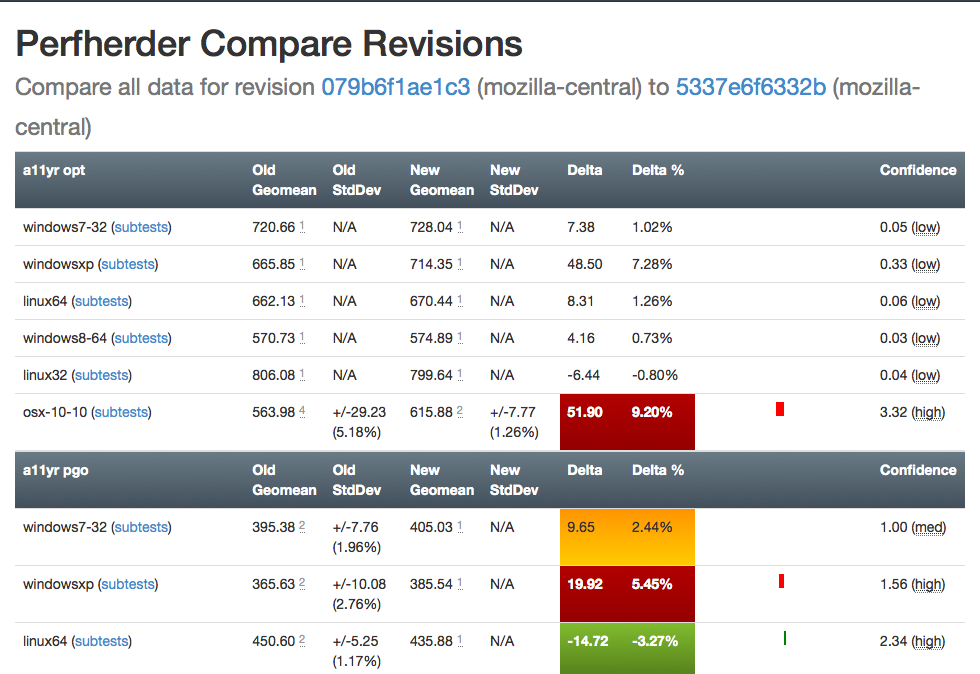
Compare visualization improvements
I’ve been spending quite a bit of time trying to fix up the display of information in the compare view, to address feedback from developers and hopefully generally streamline things. Vladan (from the perf team) referred me to Blake Winton, who provided tons of awesome suggestions on how to present things more concisely.
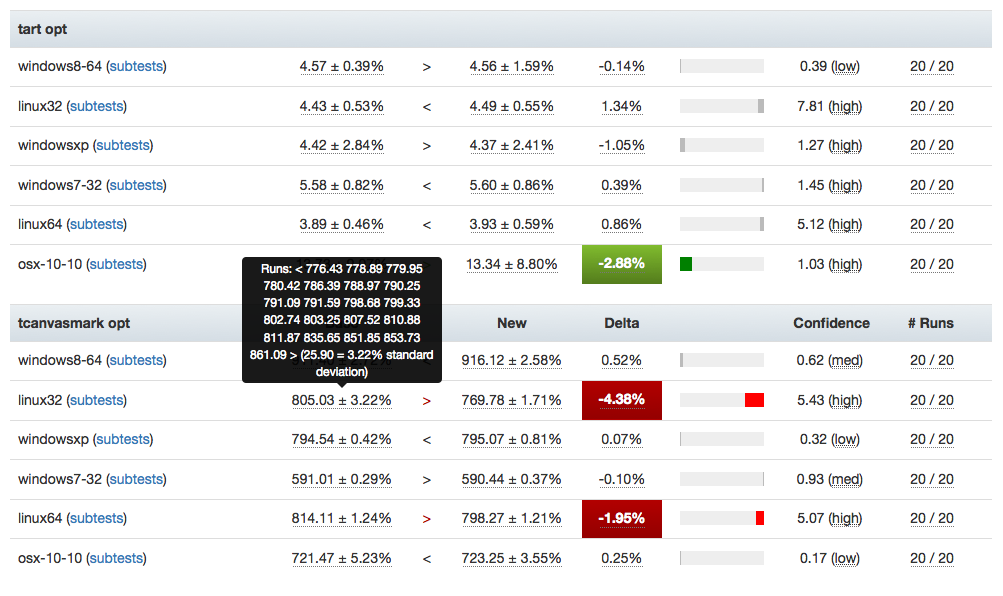
Here’s an old versus new picture:
Summary of significant changes in this view:
- Removed or consolidated several types of numerical information which were overwhelming or confusing (e.g. presenting both numerical and percentage standard deviation in their own columns).
- Added tooltips all over the place to explain what’s being displayed.
- Highlight more strongly when it appears there aren’t enough runs to make a definitive determination on whether there was a regression or improvement.
- Improve display of visual indicator of magnitude of regression/improvement (providing a pseudo-scale showing where the change ranges from 0% : 20%+).
- Provide more detail on the two changesets being compared in the header and make it easier to retrigger them (thanks to Mike Ling).
- Much better and more intuitive error handling when something goes wrong (also thanks to Mike Ling).
The point of these changes isn’t necessarily to make everything “immediately obvious” to people. We’re not building general purpose software here: Perfherder will always be a rather specialized tool which presumes significant domain knowledge on the part of the people using it. However, even for our audience, it turns out that there’s a lot of room to improve how our presentation: reducing the amount of extraneous noise helps people zero in on the things they really need to care about.
Special thanks to everyone who took time out of their schedules to provide so much good feedback, in particular Avi Halmachi, Glandium, and Joel Maher.
Of course more suggestions are always welcome. Please give it a try and file bugs against the perfherder component if you find anything you’d like to see changed or improved.
Getting the word out
Hammersmith:mozilla-central wlach$ hg push -f try
pushing to ssh://hg.mozilla.org/try
no revisions specified to push; using . to avoid pushing multiple heads
searching for changes
remote: waiting for lock on repository /repo/hg/mozilla/try held by 'hgssh1.dmz.scl3.mozilla.com:8270'
remote: got lock after 4 seconds
remote: adding changesets
remote: adding manifests
remote: adding file changes
remote: added 1 changesets with 1 changes to 1 files
remote: Trying to insert into pushlog.
remote: Inserted into the pushlog db successfully.
remote:
remote: View your change here:
remote:   https://hg.mozilla.org/try/rev/e0aa56fb4ace
remote:
remote: Follow the progress of your build on Treeherder:
remote:   https://treeherder.mozilla.org/#/jobs?repo=try&revision=e0aa56fb4ace
remote:
remote: It looks like this try push has talos jobs. Compare performance against a baseline revision:
remote:   https://treeherder.mozilla.org/perf.html#/comparechooser?newProject=try&newRevision=e0aa56fb4ace
Try pushes incorporating Talos jobs now automatically link to perfherder’s compare view, both in the output from mercurial and in the emails the system sends. One of the challenges we’ve been facing up to this point is just letting developers know that Perfherder exists and it can help them either avoid or resolve performance regressions. I believe this will help.
Data quality and ingestion improvements
Over the past couple weeks, we’ve been comparing our regression detection code when run against Graphserver data to Perfherder data. In doing so, we discovered that we’ve sometimes been using the wrong algorithm (geometric mean) to summarize some of our tests, leading to unexpected and less meaningful results. For example, the v8_7 benchmark uses a custom weighting algorithm for its score, to account for the fact that the things it tests have a particular range of expected values.
To hopefully prevent this from happening again in the future, we’ve decided to move the test summarization code out of Perfherder back into Talos (bug 1184966). This has the additional benefit of creating a stronger connection between the content of the Talos logs and what Perfherder displays in its comparison and graph views, which has thrown people off in the past.
Continuing data challenges
Having better tools for visualizing this stuff is great, but it also highlights some continuing problems we’ve had with data quality. It turns out that our automation setup often produces qualitatively different performance results for the exact same set of data, depending on when and how the tests are run.
A certain amount of random noise is always expected when running performance tests. As much as we might try to make them uniform, our testing machines and environments are just not 100% identical. That we expect and can deal with: our standard approach is just to retrigger runs, to make sure we get a representative sample of data from our population of machines.
The problem comes when there’s a pattern to the noise: we’ve already noticed that tests run on the weekends produce different results (see Joel’s post from a year ago, “A case of the weekends”) but it seems as if there’s other circumstances where one set of results will be different from another, depending on the time that each set of tests was run. Some tests and platforms (e.g. the a11yr suite, MacOS X 10.10) seem particularly susceptible to this issue.
We need to find better ways of dealing with this problem, as it can result in a lot of wasted time and energy, for both sheriffs and developers. See for example bug 1190877, which concerned a completely spurious regression on the tresize benchmark that was initially blamed on some changes to the media code: in this case, Joel speculates that the linux64 test machines we use might have changed from under us in some way, but we really don’t know yet.
I see two approaches possible here:
- Figure out what’s causing the same machines to produce qualitatively different result distributions and address that. This is of course the ideal solution, but it requires coordination with other parts of the organization who are likely quite busy and might be hard.
- Figure out better ways of detecting and managing these sorts of case. I have noticed that the standard deviation inside the results when we have spurious regressions/improvements tends to be higher (see for example this compare view for the aforementioned “regression”). Knowing what we do, maybe there’s some statistical methods we can use to detect bad data?
For now, I’m leaning towards (2). I don’t think we’ll ever completely solve this problem and I think coming up with better approaches to understanding and managing it will pay the largest dividends. Open to other opinions of course!