[ For more information on the Eideticker software I’m referring to, see this entry ]
Here’s a long overdue update on where we’re at with Eideticker for FirefoxOS. While we’ve had a good amount of success getting useful, actionable data out of Eideticker for Android, so far we haven’t been able to replicate that success for FirefoxOS. This is not for lack of trying: first, Malini Das and then me have been working at it since summer 2012.
When it comes right down to it, instrumenting Eideticker for B2G is just a whole lot more complex. On Android, we could take the operating system (including support for all the things we needed, like HDMI capture) as a given. The only tricky part was instrumenting the capture so the right things happened at the right moment. With FirefoxOS, we need to run these tests on entire builds of a whole operating system which was constantly changing. Not nearly as simple. That said, I’m starting to see light at the end of the tunnel.
Platforms
We initially selected the pandaboard as the main device to use for eideticker testing, for two reasons. First, it’s the same hardware platform we’re targeting for other b2g testing in tbpl (mochitest, reftest, etc.), and is the platform we’re using for running Gaia UI tests. Second, unlike every other device that we’re prototyping FirefoxOS on (to my knowledge), it has HDMI-out capability, so we can directly interface it with the Eideticker video capture setup.
However, the panda also has some serious shortcomings. First, it’s obviously not a platform we’re shipping, so the performance we’re seeing from it is subject to different factors that we might not see with a phone actually shipped to users. For the same reason, we’ve had many problems getting B2G running reliably on it, as it’s not something most developers have been hacking on a day to day basis. Thanks to the heroic efforts of Thomas Zimmerman, we’ve mostly got things working ok now, but it was a fairly long road to get here (several months last fall).
More recently, we became aware of something called an Elmo which might let us combine
the best of both worlds. An elmo is really just a tiny mounted video camera with a bunch of outputs, and is I understand most commonly used to project documents in a classroom/presentation setting. However, it seems to do a great job of capturing mobile phones in action as well.
The nice thing about using an external camera for the video capture part of eideticker is that we are no longer limited to devices with HDMI out — we can run the standard set of automated tests on ANYTHING. We’ve already used this to some success in getting some videos of FirefoxOS startup times versus Android on the Unagi (a development phone that we’re using internally) for manual analysis. Automating this process may be trickier because of the fact that the video capture is no longer “perfect”, but we may be able to work around that (more discussion about this later).
FirefoxOS web page tests
These are the same tests we run on Android. They should give us an idea of roughly where our performance when browsing / panning web sites like CNN. So far, I’ve only run these tests on the Pandaboard and they are INCREDIBLY slow (like 1–3 frames per second when scrolling). So much so that I have to think there is something broken about our hardware acceleration on this platform.
FirefoxOS application tests
These are some new tests written in a framework that allows you to script arbitrary interactions in FirefoxOS, like launching applications or opening the task switcher.
I’m pretty happy with this. It seems to work well. The only problems I’m seeing with this is with the platform we’re running these tests on. With the pandaboard, applications look weird (since the screen resolution doesn’t remotely resemble the 320×480 resolution on our current devices) and performance is abysmal. Take, for example, this capture of application switching performance, which operates only at roughly 3–4 fps:
So what now?
I’m not 100% sure yet (partly it will depend on what others say as well as my own investigation), but I have a feeling that capturing video of real devices running FirefoxOS using the Elmo is the way forward. First, the hardware and driver situation will be much more representative of what we’ll actually be shipping to users. Second, we can flash new builds of FirefoxOS onto them automatically, unlike the pandaboards where you currently either need to manually flash and reset (a time consuming and error prone process) or set up an instance of mozpool (which I understand is quite complicated).
The main use case I see with eideticker-on-panda would be where we wanted to run a suite of tests on checkin (in tbpl-like fashion) and we’d need to scale to many devices. While cool, this sounds like an expensive project (both in terms of time and hardware) and I think we’d do better with getting something slightly smaller-scale running first.
So, the real question is whether or not the capture produced by the Elmo is amenable to the same analysis that we do on the raw HDMI output. At the very least, some of eideticker’s image analysis code will have to be adapted to handle a much “noisier” capture. As opposed to capturing the raw HDMI signal, we now have to deal with the real world and its irritating fluctuations in ambient light levels and all that the rest. I have no doubt it is *possible* to compensate for this (after all this is what the human eye/brain does all the time), but the question is how much work it will be. Can’t speak for anyone else at Mozilla, but I’m not sure if I really have the time to start a Ph.D-level research project in computational vision. 😉 I’m optimistic that won’t be necessary, but we’ll just have to wait and see.
I promised a few people I’d blog about this, so here you go.
To help with the business of making Android or FirefoxOS devices do our bidding, Mozilla Automation & Tools developed a Python library called mozdevice which allows you to control these devices either using the Android Debug Bridge protocol (which is actually not Android specific: FirefoxOS devices use it too) or the System Under Test protocol (a Mozilla-specific thing).
Anyone familiar with debugging these devices is doubtless familiar with adb, which provides a command line interface that allows you to push/pull files, run a shell, etc. To help test our python code (as well as expand the scope of what’s possible on the command line), I created a similar utility a few months ago called “dm” which provides a command-line interface to the aforementioned mozdevice code. It’s shipped as part of mozdevice, and testing it out is pretty simple if you have virtualenv installed:
virtualenv mozdevice
cd mozdevice
./bin/pip install mozdevice
source bin/activate
dm --help
I generally use this utility for two things:
- Testing out mozdevice code. For example, today we discovered an (unfortunate) bug in devicemanagerADB’s killProcess routine. It was easy to verify both the problem and my fix did what I expected by starting my custom build of fennec and running this command:
dm —package-name org.mozilla.fennec_wlach killapp org.mozilla.fennec_wlach
(yes, it's a bit unfortunate that this bug occurred in the first place: devicemanagerADB really needs unit tests)

  2. Day-to-day menial tasks, like getting device info/status, capturing screenshots, etc. You can get a full list of what this utility is capable of by running :help. E.g.:

    ```
(mozbase)wlach@eideticker:~/src/eideticker$ dm --help
Usage: dm [options] <command> [<args>]

device commands:
  info [os|id|uptime|systime|screen|memory|processes] - get
      information on a specified aspect of the device (if no argument
      given, print all available information)
  install <file> - push this package file to the device and install it
  killapp <process name> - kills any processes with a particular name
      on device
  launchapp <appname> <activity name> <intent> <URL> - launches
      application on device
  ls <remote> - list files on device
  ps  - get information on running processes on device
  pull <local> [remote] - copy file/dir from device
  push <local> <remote> - copy file/dir to device
  rm <remote> - remove file from device
  rmdir <remote> - recursively remove directory from device
  screencap <png file> - capture screenshot of device in action
  shell <command> - run shell command on device

Options:
  -h, --help            show this help message and exit
  -v, --verbose         Verbose output from DeviceManager
  --host=HOST           Device hostname (only if using TCP/IP)
  -p PORT, --port=PORT  Custom device port (if using SUTAgent or adb-over-tcp)
  -m DMTYPE, --dmtype=DMTYPE
                        DeviceManager type (adb or sut, defaults to adb)
  -d HWID, --hwid=HWID  HWID
  --package-name=PACKAGENAME
                        Packagename (if using DeviceManagerADB)
Before you ask, yes, it's technically possible to do much of this with the original adb utility. But (1) some of our internal stuff can't use adb a variety of reasons and (2) some of the tasks above (e.g. launching an app, getting a screenshot) involve considerably more typing with adb than with dm. So it's still a win. </li> </ol>

Happy command-lining!
Just a few quick notes on how to avoid a class of errors I’ve been seeing in Mozilla’s automation over the last year. Since python interprets code dynamically, it’s pretty easy for problems like undefined variables to slip through, especially if they’re in a codepath that isn’t frequently tested. The most recent example I found was in some cleanup-after-error code for remote mochitest/reftest, which tried to call “self.cleanup” from a standalone method.
def main():
      ...
      try:
        dm.recordLogcat()
        retVal = mochitest.runTests(options)
        logcat = dm.getLogcat()
      except:
        print "TEST-UNEXPECTED-FAIL | %s | Exception caught while running tests." % sys.exc_info()[1]
        mochitest.stopWebServer(options)
        mochitest.stopWebSocketServer(options)
        try:
            self.cleanup(None, options)
        except:
            pass
testing/mochitest/runtestsremote.py
We’re calling cleanup as if it were a class variable, but we’re not inside any class! It’s easy to see what will happen if you try to run some similar code from the python console:
>>> self.cleanup()
Traceback (most recent call last):
  File "<stdin>", line 1, in <module>
NameError: name 'self' is not defined
However, because we’re in a blanket try…except, we will never see an error. The cleanup code will never be called, instead the exception is immediately caught and subsequently ignored. Probably not the end of the world in this case (there are other parts of our mobile automation which will perform the same cleanup later), but it’s easy to imagine where this would be a more serious problem.
There’s two very easy ways to help stop errors like this before they hit our code:
- Try to avoid using a blanket try…except. In addition to catching legitimate problems which we want to ignore (in the remote case for example, devicemanager exceptions), it also catches (and thus obscures) things like syntax, name, or type errors. Instead, try just catching the specific exception you’re looking for. For example, we might rewrite the case above as:
try: mochitest.cleanup(None, options) except devicemanager.DMError: print “WARNING: Device error while cleaning up”
2. pyflakes, pyflakes, pyflakes. [Pyflakes][2] is a fantastic tool for analyzing your python code for common problems. It's kind of analagous to [jslint][3], for those of you familiar with that. Here's what happens when we run pyflakes against the offending code:

    ```
wlach@eideticker:~/src/mozilla-central$ pyflakes testing/mochitest/runtestsremote.py
testing/mochitest/runtestsremote.py:7: 'time' imported but unused
testing/mochitest/runtestsremote.py:481: undefined name 'self'
testing/mochitest/runtestsremote.py:500: undefined name 'self'
I've found pyflakes to be an indispensable part of my workflow. I generally run it after making any substantial change to a python file, and certainly before pushing anything to be consumed by others.
Ultimately there’s no substitute for actually thoroughly testing your code, no matter what language you’re using. But using the right techniques and tools can certainly make your life easier.
[ for those wondering, a fix for the issue mentioned in this post is part of bug 801652 ]
Inspired by the work I’d been doing with Benoit Girard to integrate the Firefox Profiler with Eideticker, I decided to create an easy-to-use python script to help with gathering profiles on Fennec, which I call frof.
Frof pretty considerably reduces the amount of busywork you need to do to gather a profile. Instead of a rather complicated multi-step process to initialize fennec with the right parameters for profiling, downloading profiles, etc., you can just run the frof script like so:
<br /> frof org.mozilla.fennec http://wrla.ch mywonderfulprofile.zip<br />
Assuming that frof was bootstrapped correctly (and your phone is connected to your computer in debugging mode), this should start up fennec automatically with that URL loaded. Now, just perform whatever action you want to profile on your phone, then press enter in the terminal when you’re done. Voila, instant profile trace which you can examine, post to bugs, etc. All the other details are automated.
Backstory: the inspiration for frof came from a personal itch of mine, the fact that leaflet.js maps seem to be causing out-of-memory errors on Fennec when zooming is enabled (bug 784580). I wanted to be able to capture some profiles to see what was going on, but the current instructions on MDN seem a bit unwieldly. I figured I’d get lots of mileage out of a tool to make this easier (especially if I was going to get into a profile, edit, debug cycle), so I spent a few hours dilligently copying the logic we put into eideticker to gather profiles into a standalone script.

Unfortunately in my case, the gecko profile didn’t tell me much, aside from the fact that Gecko didn’t seem to be the culprit (remember that on Android we also have lots of Java-based frontend code to contend with, which the profiler doesn’t measure). I’m going to stare more at the Java code and dig into the various high-level tools that Android provides for profiling performance and memory usage. My current hypothesis is that the problem is the screenshot code and the CSS transitions that leaflet generates when zooming. In the mean time, the only thing I have to show for my foray away from writing tools for Mozilla is yet another tool.
Oh well, it could be worse. My fervent hope is that frof will be helpful for both Fennec developers and QA. Let me know if you wind up using it!
[ For more information on the Eideticker software I’m referring to, see this entry ]
Just wanted to give some updates on a few new Eideticker features which have landed in the past week.
Profiling support
While Eideticker is a great tool for observing the external behaviour of the mobile browser, it hasn’t been able to tell us much about what’s going on inside. If something’s slow, why is it slow? If it’s slower than it was the day before, what’s the cause? If it’s faster? What explains the deviations in test results from one run to the other?
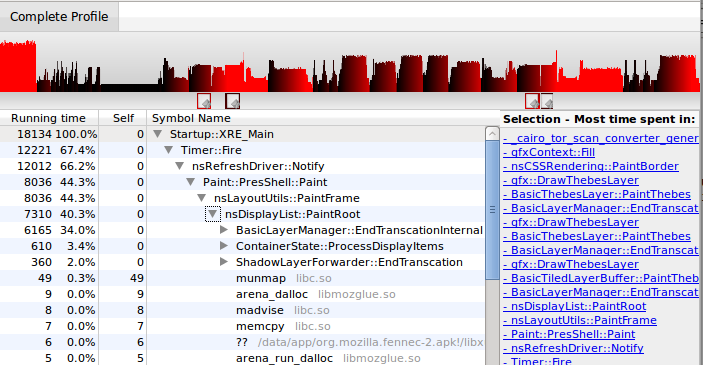
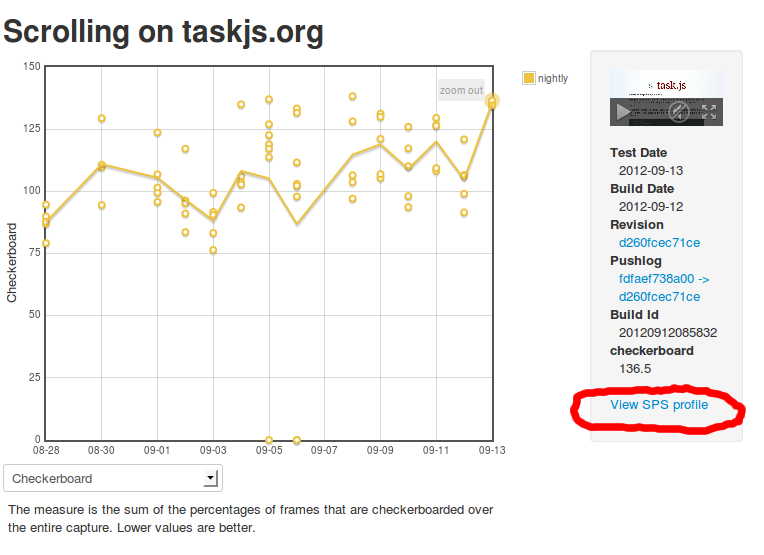
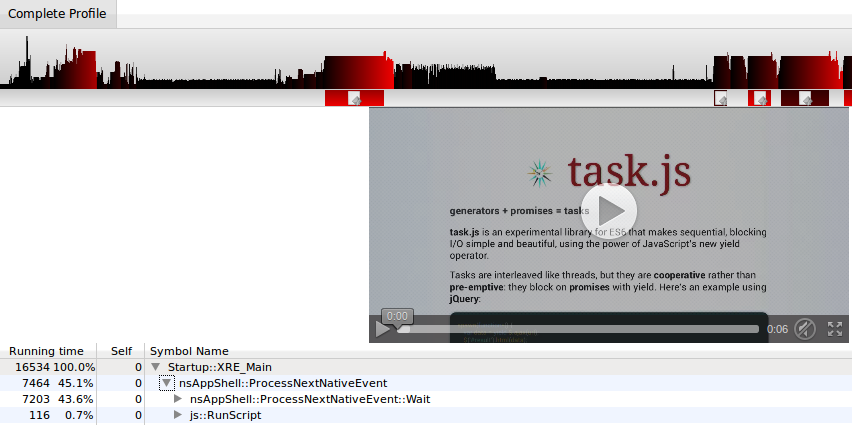
Thanks to Benoit Girard (+ a little bit of integration work from me), we can now start providing answers to these questions. Eideticker now has a mode that allows us to capture a sampling profile of the application while the video capture is ongoing. From the dashboard, you can now get access said profile, just by clicking on a link.


Note that the profile is not yet synchronized precisely to the videocapture (the profile works over the entire run of the browser), but Benoit is busily making that happen. That should hopefully land soon, in the mean time we still have some pretty useful data.
To say I’m excited about this would be an understatement. I think it has the potential to open up a whole new world of understanding of why our mobile (and desktop, someday) browser performs the way it does.
Startup / pageload testing
Eideticker has had support for measuring startup and page load time for a few months now, but I hadn’t yet hooked it up to the dashboard. As of today, it now is. There’s a bunch of different angles that are interesting to measure here (new vs. old profiles, whether the browser has been launched since boot, launching web applications, loading about:home or loading a web page, …) which I’ll get to in due course. For now, we at least have a baseline of how long it takes to see the Firefox homescreen on a Galaxy Nexus:
Of course, this is hooked up to the profiling support previously mentioned. Here’s an example profile.
I’ve already filed one bug based on the data gathered so far.
[ For more information on the Eideticker software I’m referring to, see this entry ]

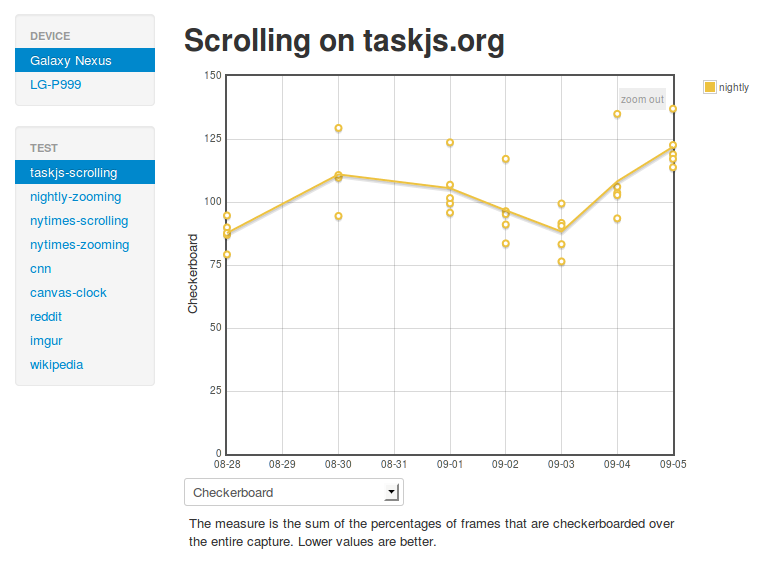
More on this to come, but just a quick note that the client-side URL schema for the Eideticker dashboard has been changed, as we now gather benchmarks for more than one device (Samsung Galaxy Nexus benchmarks FTW). To get the new and improved dashboard, please just go to the root:
http://wrla.ch/eideticker/dashboard
Old style URLs like http://wrla.ch/eideticker/dashboard/#/taskjs-scrolling/checkerboard will no longer work. Sorry for any broken links, this is the price of progress. 😉
Note that some benchmarks for the Galaxy Nexus are still missing. This is a known problem and will be fixed soon.
[ For more information on the Eideticker software I’m referring to, see this entry ]
I just merged a new approach I’ve been using to simulate touch events into the master branch of Eideticker called Orangutan.

As I’ve mentioned before, we really need to simulate actual user gestures when doing this type of testing to measure real-world performance with Eideticker. Up to now, I’ve been using google’s MonkeyRunner tool to do this. I was always a little skeptical about its approach (which involved using a privileged tool written in Java with special access to Android’s windowing system), but up until recently I’d managed to get around its issues with a successively more complicated series of hacks.
Unfortunately, I finally came up with a problem that I couldn’t figure out how to fix: monkeyrunner doesn’t attach precise timing information to the events it generates, which completely throws off Google Chrome for Android when you try to simulate a pan gesture. I’ve tried just about every way of using the existing functionality (both the networked mode and the “script” mode), but nothing seemed to help. My conclusion is that the only way of continuing to use monkey would be to create a fix for the software itself, which implies forking and extending the entire Android Open Source Project. As noble a goal as that might be, doing that across all the major Android versions I want to support (2.2, 2.3, 4.0 and now 4.1) was more work than I felt like taking on (not to mention the question of how to deploy that work). I decided to build something entirely new which did not have this requirement.
Enter Orangutan. Unlike MonkeyRunner, Orangutan simply injects events directly into low-level the kernel device file that represents an Android device’s touch screen. It’s fast (written in native C), trivial to build, and seems to work seamlessly with any application I’ve tried using it with (including Google Chrome for Android). Most interestingly for Mozilla, this interface is also present on Firefox OS (Boot to Gecko) based devices, so we should be able to use Orangutan there to support both Eideticker and any other testing framework which needs to test real-world user input test cases. Exciting times!
A while back, I began work on a new test framework for mobile browsers called Eideticker, which aims to benchmark browsers by capturing them on HMDI video, then running image analysis on the result. I wrote about this in a blog post entitled, “Measuring what the user sees.” Some seven months later, we are about to release a new version of Firefox for Android and Eideticker has played a major role in qualifying its performance and identifying areas for improvement along the way.
I thought it would be worth publicizing some of the results that we have seen so far and explain why Eideticker has been useful. This post aims to explain the ideas behind Eideticker and hopes to inspire ideas on how to further improve objective cross-browser benchmarks.
Idea 1: Put cross-browser performance tests on a more rigorous footing
One of the problems with existing benchmarks is that the graphical performance that they measure is entirely synthetic. So when something like Microsoft’s fishbowl demo claims 50 frames per second, that is based entirely on an internal measurement. There is no guarantee that is what the user is actually seeing. For all we know, it could be throwing half those frames away. To say nothing of the fact that measuring the results could interfere with the results themselves!
With Eideticker, we only analyze what the user sees (under the assumption that what the user sees is what comes out of the device’s HDMI out). To measure frame rate, Eideticker painstakingly analyzes a video capture to see the difference between each frame. Only if one frame is qualitatively different than the one before it will it consider it to be a step forward in the animation progression. There is no room for a browser to “cheat” by, for example, throwing a frame away. Here are two example frames from an Eideticker capture of an animated clock, along with a visual representation of the difference it measured between them:
Note: The red area of the graphic on the right indicates a region that Eideticker has detected as having changed between the two images. The black area of the graphic indicates a region that is unchanged.
Seeing visual evidence like this increases our confidence that things are truly better than they were before. For example, Eideticker very clearly, and accurately, measured the improvement when Off Main Thread Compositing landed. We saw a big performance jump in the afore-mentioned clock benchmark:
Note: Nightly = the new Firefox for Android as of that date (an incremental step towards what was just released), XUL = Previous Firefox for Android, Stock = Default browser that comes with Android 2.2.
Idea 2: Measure subjective performance based on actual user interaction patterns
Measuring real browser output is useful, but the problem is that these benchmarks do not actually measure how a user experiences the Web. Does an animated image of a clock or a fishtank actually represent a normal user experience? Thanks to the development of mobile gaming, this is slowly changing, but I was still say “no.” The majority of users time spent mobile browsing is spent on news websites, Wikipedia, Facebook and I Can Haz Cheezburger. For these sites, I would submit that there are two things users care about:
-
When I swipe to move the content (e.g. to scroll down to see more content on CNN.com), does it respond instantaneously and in a pleasing manner? Do I see a nice smooth animation or a jerky mess?
-
When the content moves, do I see new content right away? Or do I have to wait a few moments while the view updates (this slow load is also called checkerboarding)?
I think the key here is to measure what the user sees. Internal measurements for anything other than what the user experiences are misleading and inconsistent across browsers.
For the first item, I believe the best indication of perceived responsiveness and smoothness is found by measuring the number of frames that are displayed in response to user interaction. As with all measurements, it is not perfect, but one can safely say that if there are only a few frames changed in response to a swipe, the experience is going to be jerky.
Compare these two videos of panning on CNN.com. The first is the previous Firefox for Android, clocking in at about 12.3 frames per second (fps). The second is the recent Firefox for Android , clocking in at 23 fps using Eideticker’s internal measurements:
For the second, we can easily measure how quickly a user sees content by setting the background color of the page to an obvious color (in Eideticker we use magenta), overlaying an image on top, then measuring the amount of the page that is magenta while panning around. Since all modern browsers just use the background color of the page when something is to be redrawn (or at least can be configured that way), it’s easy to compare across browsers. You can see in the videos above that the new Native Firefox does much better than the old one in this regard, at least on this benchmark. Here’s an image of Eideticker detecting checkerboarding on a capture (red indicates checkerboarded areas):
Note: The red area of the graphic on the right indicates a region that Eideticker has detected as checkerboarded (i.e. undrawn). The black area of the graphic indicates a region that is fully drawn.
The important thing in both cases is that these captures represent a real user experience. The swipe gestures are synthesized such that they are interpreted by Android as an actual touch event. This is important: using tricks like javascript scrollTo inside your Web page to pan would not actually engage the renderer in quite the same way. On Firefox for Android (and probably other browsers as well, though I haven’t checked), the response to a touch event is always handled inside the browser internal rendering engine to give the expected “physical feel.” Manually moving the viewport would give completely different results since so much of the fancy code we use to reduce the redraw delay would not be engaged.
Conclusion
Overall, I am very happy with how Eideticker has allowed us to track and measure improvements in Firefox for Android. In developing Eideticker, we aimed to create a benchmark that measured how users actually interact with a browser – not how abstract measurements claim how great a browser is. As we move ahead with new projects to improve Firefox for Android, Eideticker will continue to be useful in making sure that using our browser is the best experience that it can be, especially combined with other tools like Benoit Girard’s sampling profiler.
For more information on Eideticker, feel free to visit its homepage on wiki.mozilla.org.
Recently the Firefox source repository (mozilla-central) was converted over recently to a new license with a lovely short boilerplate. This is great, but here in automation and tools, we have a fairly large number of projects that live outside of the main tree but for which the new license still applies. A few weeks ago, I wanted to move one our projects over (mozbase), but didn’t want to spend hours manually editing text files. I understand that a script was used to convert mozilla-central, but a quick google didn’t turn it up. [ edit:** thanks to Ed Morley for pointing out to me that it lives here: http://hg.mozilla.org/users/gerv_mozilla.org/relic/ **]
I surely could have asked about where this script is, but this problem gave me an excuse to try something that I’d been meaning to for a while: Facebook’s codemod. Codemod is a neat little command-line utility which aims to help with mass refactorings of code. All you have to do is provide a few regular expressions to replace, and off it goes. I tried it out with mozbase, and the results were great: 5 minutes spent coming up with a regular expression and jiggering with command line options, and the job was done.
I had the desire to do this again today for Eideticker, and decided to document the (extremely simple) process for posterity. I just used this simple command line…
../codemod/src/codemod.py --extensions py -m '# \*\*\*\*\* BEGIN LICENSE.*END LICENSE BLOCK \*\*\*\*\*' '# This Source Code Form is subject to the terms of the Mozilla Public\n# License, v. 2.0. If a copy of the MPL was not distributed with this file,\n# You can obtain one at http://mozilla.org/MPL/2.0/.'
… et voila, out popped shiny new boilerplate.
So yesterday we had a small get-together at my place, which gave me the opportunity to try something I’d been meaning to do for a while: build my own retroscope.
The idea is pretty simple: have a webcam record bits and pieces of a social event, then play them back on-the-spot a few minutes/hours later. I first heard about the concept from reading Nat Friedman’s blog entry from 2005 — if you read that, you see that he just hooked up a video camera to his TiVo. 7 years in the future, laptop webcams are ubiquitous and we have the awesome HTML5 tag, so I figured it would be easy to knock up something interesting in short order with zero custom hardware.
Having only remembered that I wanted to do this about 30 minutes before people were scheduled to start arriving, I didn’t have much time to do anything really perfect. I settled on using this little snippet from stackoverflow to generate short (5 second) movies on my laptop, then used scp to copy them over and display a montage of them in an auto-refreshing webpage on my “television” (which is a Mac-Mini connected to a large computer monitor). Despite being a total hack job, the end result generated much amusement. I think this is a bit different from what Nat originally did (it sounds from his blog like his retroscope played back longer segments), but I think the end result is actually a bit more fun.

Perhaps unfortunately, but probably ultimately for the best, only a few snippets from the actual night got stored away. One example is this gem:
(yes, that handsome fellow with the Pernot is me)
I thought it might be fun to release the slightly-cleaned up results of this experiment as opensource for others to play with, so I created a small project for it on github. Unlike the original version, no complicated scp scheme is required — I just reused Joel Maher’s most excellent mozhttpd library from mozbase to run a web server in the same process as the capture logic. All you need to do is run the server on a Linux machine with a webcam and connect to it with a web browser from any other machine on your local network.
https://github.com/wlach/retroscope
Enjoy!
