Just a note that I’ve decided to step back from metrics graphics maintenance for the time being, which means that the project is essentially unowned. This has sort of been the case for a while, but I figured I should probably make it official.
If you follow the link to the metrics graphics repository, you’ll note that the version has been bumped to “3.0-alpha3”. I was this close to making one last new release this afternoon but decided I didn’t want to potentially break existing users who were fine using the last “official” version (v3.0 bumps the version of d3 used to “5”, among other breaking changes). I’d encourage people who want to continue using the library to make a fork and publish a copy under their user or organization name on npm.
For those who are still wondering, yup, I am still maintaining mozregression, though increasingly reluctantly. Given how important this project is to the development of Firefox (getting a regression window using mozregression is standard operating procedure whenever a new bug is reported in Firefox), it feels like this project is pretty vital, so I continue out of some sense of obligation — but really, someone more interested in Mozilla’a build, automation and testing systems would be better suited to this task: over the past few years, my interests/focus have shifted away from this area to building up Mozilla’s data storage and visualization platform.
This post will describe some of the things that have happened in the last year and where I see the project going. My hope is to attract some new blood to add some needed features to the project and maybe take on some of the maintainership duties.
python 3
The most important update is that, as of today, the command-line version of mozregression (v3.0.1) should work with python 3.5+. modernize did most of the work for us, though there were some unit tests that needed updating: special thanks to @gloomy-ghost for helping with that.
For now, we will continue to support python 2.7 in parallel, mainly because the GUI has not yet been ported to python 3 (more on that later) and we have CI to make sure it doesn’t break.
other updates
The last year has mostly been one of maintenance. Thanks in particular to Ian Moody (:kwan) for his work throughout the year — including patches to adapt mozregression support to our new updates policy and shippable builds (bug 1532412), and Kartikaya Gupta (:kats) for adding support for bisecting the GeckoView example app (bug 1507225).
future work
There are a bunch of things I see us wanting to add or change with mozregression over the next year or so. I might get to some of these if I have some spare cycles, but probably best not to count on it:
- Port the mozregression GUI to Python 3 (bug 1581633) As mentioned above, the command-line client works with python 3, but we have yet to port the GUI. We should do that. This probably also entails porting the GUI to use PyQT5 (which is pip-installable and thus much easier to integrate into a CI process), see bug 1426766.
- Make self-contained GUI builds available for MacOS X (bug 1425105) and Linux (bug 1581643).
- Improve our mechanism for producing a standalone version of the GUI in general. We’ve used cx_Freeze which mostly works ok, but has a number of problems (e.g. it pulls in a bunch of unnecessary dependencies, which bloats the size of the installer). Upgrading the GUI to use python 3 may alleviate some of these issues, but it might be worth considering other options in this space, like Gregory Szorc’s pyoxidizer.
- Add some kind of telemetry to mozregression to measure usage of this tool (bug 1581647). My anecdotal experience is that this tool is pretty invaluable for Firefox development and QA, but this is not immediately apparent to Mozilla’s leadership and it’s thus very difficult to convince people to spend their cycles on maintaining and improving this tool. Field data may help change that story.
- Supporting new Mozilla products which aren’t built (entirely) out of mozilla-central, most especially Fenix (bug 1556042) and Firefox Reality (bug 1568488). This is probably rather involved (mozregression has a big pile of assumptions about how the builds it pulls down are stored and organized) but that doesn’t mean that this work isn’t necessary.
If you’re interested in working on any of the above, please feel free to dive in on one of the above bugs. I can’t offer formal mentorship, but am happy to help out where I can.
I’ve been a bit bad about updating this blog over the past year or so, though this hasn’t meant there haven’t been things to talk about. For the next couple weeks, I’m going to try to give some updates on the projects I have been spending time on in the past year, both old and new. I’m going to begin with some of the less-loved things I’ve been working on, partially in an attempt to motivate some forward-motion on things that I believe are rather important to Mozilla.
More to come.
With lots of sadness, I just gave away my vintage 1970s velo-sport. This was my first bike I owned as a mid-twentysomething adult (I temporarily gave up biking and took up smoking when I was 19, two of the worst decisions of my life). Picked it up at the suggestion of my now ex-wife after frustration with the Halifax bus system. Used it to hack said transit system amidst riding hundreds and hundreds of kilometres on the Halifax penisula and beyond. A few years later, it came with me to Montreal, where we rode even more - near-daily commutes from NDG to Mile End and rides for pie to Mont St Hilaire. Finally, it was fated to come with me to Toronto, where it served to take me on long rides on the waterfront trail, east to Pickering, west as far as Niagara Falls, as well as serving as a daily commuter from Leslieville to my office in the Fashion District, not to mention early-morning jaunts across town for 6am sittings at the Toronto Zen Centre.
![]()
Over the years, I’ve probably sunk over two thousand dollars into repairs (as well as doing a fair number of work on it myself). An issue with the front wheel puncturing three tubes in succession finally convinced me that this was a losing battle, unless I wanted to put down a large sum into an overhaul. If I used it less I could probably justify some more minor repairs, but I think most of it (with the exception of the frame and headset) is on its last legs. Given the amount that I bicycle, it just seemed to make sense to get a new one, and see what a modern commuter has to offer. So I decided to cut my losses and buy a brand new one at Urbane Cycling.
It was a hard decision to replace it, and harder still to give it away. I loved this old bike, far more than any inanimate thing that has been in my presence. I am grateful for the good care it took of me (I have not had a single major accident riding it), and the adventures it enabled me to have. I took this picture of it in the donation rack at Bikesauce, which is almost certainly the last I’ll see of it:
![]()
I left a note with some pointers on what needs work and asking whoever fixes it up to give it a lot of love, but honestly this bike’s fate is out of my control at this point. So it is with all things.
Last week, Brendan Colloran announced Iodide, a new take on scientific collaboration and reporting that I’ve been really happy to contribute to over the past year-and-a-bit. I’ve been describing it to people I meet as kind of "glitch meets jupyter " but that doesn’t quite do it justice. I’d recommend reading Brendan’s blog post (and taking a look at our demonstration site) to get the full picture.
One question that I’ve heard asked (including on Brendan’s post) is why we chose a rather conventional and old technology (Django) for the server backend. Certainly, Iodide has not been shy about building with relatively new or experimental technologies for other parts (e.g. Python on WebAssembly for the notebooks, React/Redux for the frontend). Why not complete the cycle by using a new-fangled JavaScript web server like, I don’t know, NestJS? And while we’re at it, what’s with iodide’s ridiculous REST API? Don’t you know GraphQL is the only legitimate way to expose your backend to the world in 2019?
The great urban theorist of the twentieth century, Jane Jacobs has a quote I love:
“Old ideas can sometimes use new buildings. New ideas must use old buildings.”
Laura Thompson (an engineering director at Mozilla) has restated this wisdom in a software development context as “Build exciting things with boring technologies”.
It so happened that the server was not an area Iodide was focusing on for innovation (at least initially), so it made much, much more sense to use something proven and battle-tested for the server side deployment. I’d used Django for a number of projects at Mozilla before this one (Treeherder/Perfherder and Mission Control) and have been wildly impressed by the project’s excellent documentation, database access layer, and support for building a standardized API via the Django REST Framework add-on. Not to mention the fact that so much of Mozilla’s in-house ops and web development expertise is based around this framework (I could name off probably 5 or 6 internal business systems based around the Django stack, in addition to Treeherder), so deploying Iodide and getting help building it would be something of a known quantity.
Only slightly more than half a year since I began work on the iodide server, we now have both a publicly accessible site for others to experiment with and an internal one for Mozilla’s business needs. It’s hard to say what would have happened had I chosen something more experimental to build Iodide’s server piece, but at the very least there would have been a substantial learning curve involved — in addition to engineering effort to fill in the gaps where the new technology is not yet complete — which would have meant less time to innovate where it really mattered. Django’s database migration system, for example, took years to come to fruition and I’m not aware of anything comparable in the world of JavaScript web frameworks.
As we move ahead, we may find places where applying new backend server technologies makes sense. Heck, maybe we’ll chose to rewrite the whole thing at some point. But to get to launch, chosing a bunch of boring, tested software for this portion of Iodide was (in my view) absolutely the right decision and I make no apologies for it.
One of my favorite parts about Mozilla is mentoring and working alongside third party contributors. Somewhat surprisingly since I work on internal tools, I’ve had a fair amount of luck finding people to help work on projects within my purview: mozregression, perfherder, metrics graphics, and others have all benefited from the contributions of people outside of Mozilla.
In most cases (a notable exception being metrics graphics), these have been internal-tooling projects used by others to debug, develop, or otherwise understand the behaviour of Firefox. On the face of it, none of the things I work on are exactly “high profile cutting edge stuff” in the way, say, Firefox or the Rust Programming Language are. So why do they bother? The exact formula varies depending on contributor, but I think it usually comes down to some combination of these two things:
- A desire to learn and demonstrate competence with industry standard tooling (the python programming language, frontend web development, backend databases, “big data” technologies like Parquet, …).
- A desire to work with and gain recognition inside of a community of like-minded people.
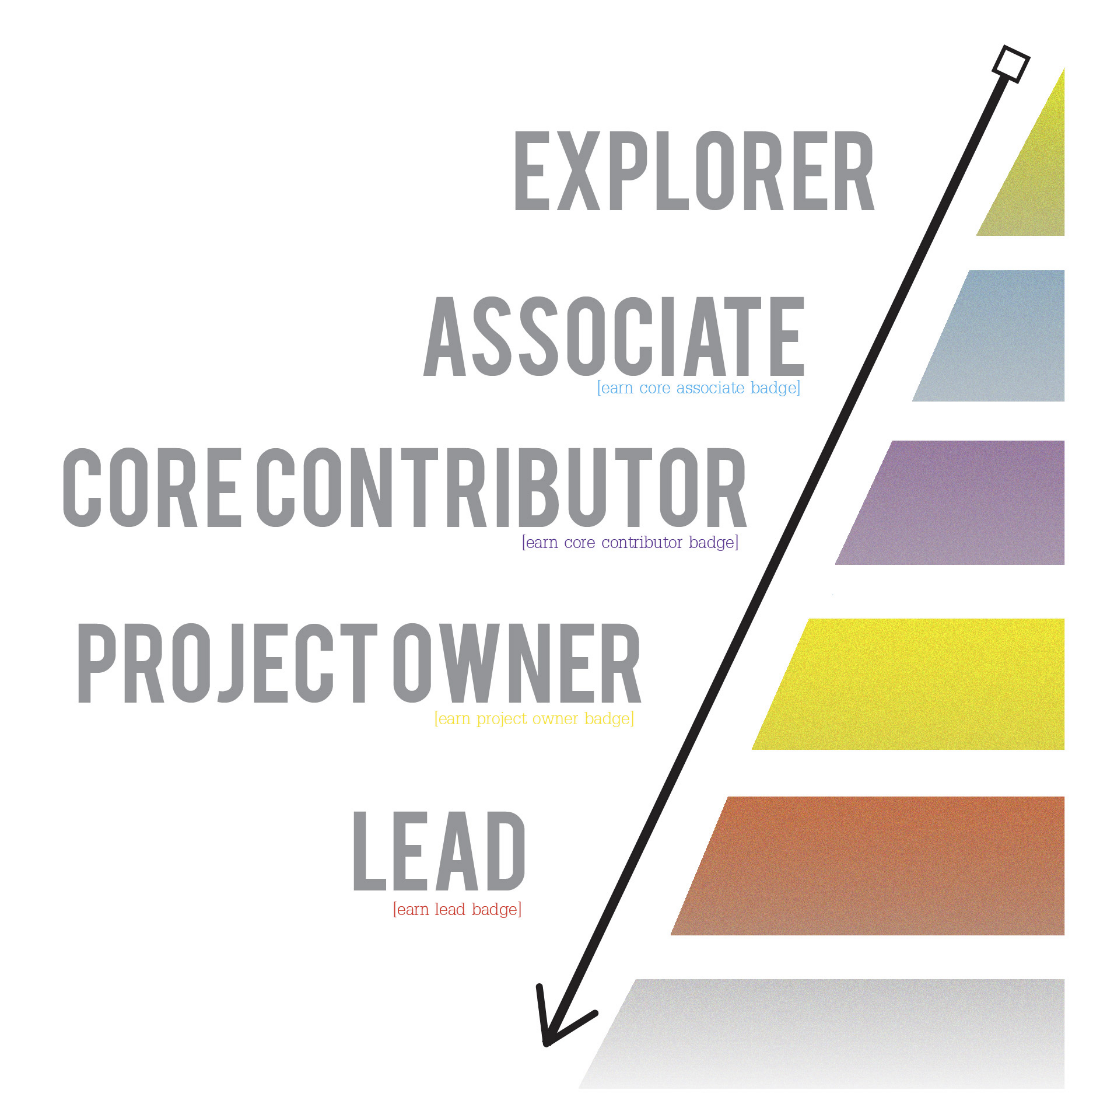
Pretty basic, obvious stuff — there is an appeal here to basic human desires like the need for security and a sense of belonging. Once someone’s “in the loop”, so to speak, generally things take care of themselves. The real challenge, I’ve found, is getting people from the “I am potentially interested in doing something with Mozilla internal tools” to the stage that they are confident and competent enough to work in a reasonably self-directed way. When I was on the A-Team, we classified this transition in terms of a commitment curve:
![]()
prototype commitment curve graphic by Steven Brown
The hardest part, in my experience, is the initial part of that curve. At this point, people are just dipping their toe in the water. Some may not have a ton of experience with software development yet. In other cases, my projects may just not be the right fit for them. But of course, sometimes there is a fit, or at least one could be developed! What I’ve found most helpful is “clearing a viable path” forward for the right kind of contributor. That is, some kind of initial hypothesis of what a successful contribution experience would look like as a new person transitions from “explorer” stage in the chart above to “associate”.
I don’t exactly have a perfect template for what “clearing a path” looks like in every case. It depends quite a bit on the nature of the contributor. But there are some common themes that I’ve found effective:
First, provide good, concise documentation both on the project’s purpose and vision and how to get started easily and keep it up to date. For projects with a front-end web component, I try to decouple the front end parts from the backend services so that people can yarn install && yarn start their way to success. Being able to see the project in action quickly (and not getting stuck on some mundane getting started step) is key in maintaining initial interest.
Second, provide a set of good starter issues (sometimes called “good first bugs”) for people to work on. Generally these would be non-critical-path type issues that have straightforward instructions to resolve and fix. Again, the idea here is to give people a sense of quick progress and resolution, a “yes I can actually do this” sort of feeling. But be careful not to let a contributor get stuck here! These bugs take a disproportionate amount of effort to file and mentor compared to their actual value — the key is to progress the contributor to the next level once it’s clear they can handle the basics involved in solving such an issue (checking out the source code, applying a fix, submitting a patch, etc). Otherwise you’re going to feel frustrated and wonder why you’re on an endless treadmill of writing up trivial bugs.
Third, once a contributor has established themselves by fixing a few of these simple issues, I try to get to know them a little better. Send them an email, learn where they’re from, invite them to chat on the project channel if they can. At the same time, this is an opportunity to craft a somewhat larger piece of work (a sort of mini-project) that they can do, tailored to the interests. For example, a new contributor on the Mission Control has recently been working on adding Jest tests to the project — I provided some basic guidance of things to look at, but did not dictate exactly how to perform the task. They figured that out for themselves.
As time goes by, you just continue this process. Depending on the contributor, they may start coming up with their own ideas for how a project might be improved or they might still want to follow your lead (or that of the team), but at the least I generally see an improvement in their self-directedness and confidence after a period of sustained contribution. In either case, the key to success remains the same: sustained and positive communication and sharing of goals and aspirations, making sure that both parties are getting something positive out of the experience. Where possible, I try to include contributors in team meetings. Where there’s an especially close working relationship (e.g. Google Summer of Code). I try to set up a weekly one on one. Regardless, I make reviewing code, answering questions, and providing suggestions on how to move forward a top priority (i.e. not something I’ll leave for a few days). It’s the least I can do if someone is willing to take time out to contribute to my project.
If this seems similar to the best practices for how members of a team should onboard each other and work together, that’s not really a coincidence. Obviously the relationship is a little different because we’re not operating with a formal managerial structure and usually the work is unpaid: I try to bear that mind and make double sure that contributors are really getting some useful skills and habits that they can take with them to future jobs and other opportunities, while also emphasizing that their code contributions are their own, not Mozilla’s. So far it seems to have worked out pretty well for all concerned (me, Mozilla, and the contributors).
Went to PyData NYC a couple weeks ago, and figured I ought to write up my thoughts for the benefits of the others on my extended team. Why not publish as a blog post while I’m at it?
This is actually the first conference I’d been to in my capacity as a “data engineer” at Mozilla, a team I joined about a year and a half ago after specializing in the same area on the (now-defunct) a-team. I’ve felt a special affinity for the Python community, particularly its data science offshoots (pandas, numpy, and jupyter notebooks) so it was great to finally go to a conference that specializes in these topics.
Overall, the conference was a bit of a mix between people talking about the status of their projects, theoretical talks on specific statistical approaches to data, general talks on how people are doing “data science” (I would say the largest majority of attendees at the conference were users of python data science tools, rather than developers), and case studies of how people are using python data science tools in their research or work. This being New York, many (probably the majority) were using data science tools in fields like quantitative finance, sales, marketing, and health care.
As a side note, it was really satisfying to be able to tell Mozilla’s story about how we collect and use data without violating the privacy of our users. This is becoming more and more of an issue (especailly in Europe with the GPDR) and it really makes me happy that we have a really positive story to tell, not a bunch of dirty secrets that we need to hide.
In general I found the last two types of talks the most rewarding to go to: most of the work I do at Mozilla currently involves larger-scale data where, I’m sad to say, Python is usually not (currently) an applicable tool, at least not by itself (though maybe iodide will help change that! see below). And I don’t usually find a 60 minute talk really enough time for me to be able to properly absorb new mathematical or statistical concepts, though I can sometimes get little tidbits of information from them that come in handy later.
Some talks that made an impression on me:
- Open source and quantitative finance: Keynote talk, was a great introduction to the paranoia of the world of quantitative finance. I think the main message was that things are gradually moving to a (slightly less) paranoid model where generally-useful modifications done to numerical/ml software as part of a trading platform may now be upstreamed… but my main takeaway is that I’m really glad I’m not working in that industry.
- Words in Space: Introduced an interesting-soundingl library called Yellow Brick for visualizing the results of machine learning models.
- Creating a data-driven product culture: General talk on how to create a positive and useful data science culture at a company. I think Mozilla already checks most of the boxes outlined in the talk.
- What Data Scientists Really Do: Quite entertaining talk on the future of “data science”, by Hugo Bowne-Anderson (who also has a podcast which sounds cool). The most interesting takeaway from the talk was the speculation that within 10 years the term “data scientist” might have the same meaning as the word “webmaster” now. It’s a hyper-generalist job description which will almost inevitably be split into a number of other more specialized roles.
- Master Class: Bayesian Statistics: This falls under the “technical talk which I couldn’t grasp in 60 minutes” category, but I think I finally do understand a little bit more of what people mean when they say “Bayesian Statistics” now. It actually doesn’t have much to do with Baye’s Theorem, rather it seems to be more of a philosophical approach to data analysis which acknowledges the limitations of human capacity to understand the world and asks us to more explicitly state our assumptions when developing models (probably over-simplifying here). I think I can get behind that — want to learn more. They provided a bunch of material to work through, which I’ve been meaning to take a look at.
- Data Science in Health Care: Beyond the Hype: Great presentations in how data science can be used to improve health care outcomes. Lots of relevant insights that I think are also applicable to “product health” here at Mozilla. I particularly liked the way the presenter framed requirements when deciding whether or not to do a type of analysis: “if i knew [information], i would do [intervention], which would have [measurable outcome]”
Of course, this post wouldn’t be complete without a mention of Mike Droettboom’s talk on iodide, a project I’ve been spending some considerable cycles helping with over the last couple of quarters. I need to write some longer thoughts on iodide at some point in the near future, but in a nutshell it’s a scientific notebook environment where the computational kernel lives entirely inside the browser. It was well received and we had a great followup session afterwards with people interested in using it for various things. Being able to show a python environment in the browser which “just works”, with no installation or other steps makes a great tech demo. I’m really excited about the public launch of our server-based environment, which will hopefully be coming in the next couple of months.
Just a quick announcement that the first “production-ready” version of Mission Control just went live yesterday, at this easy-to-remember URL:
https://missioncontrol.telemetry.mozilla.org
For those not yet familiar with the project, Mission Control aims to track release stability and quality across Firefox releases. It is similar in spirit to arewestableyet and other crash dashboards, with the following new and exciting properties:
- Uses the full set of crash counts gathered via telemetry, rather than the arbitrary sample that users decide to submit to crash-stats
- Results are available within minutes of ingestion by telemetry (although be warned initial results for a release always look bad)
- The denominator in our crash rate is usage hours, rather than the probably-incorrect calculation of active-daily-installs used by arewestableyet (not a knock on the people who wrote that tool, there was nothing better available at the time)
- We have a detailed breakdown of the results by platform (rather than letting Windows results dominate the overall rates due to its high volume of usage)
In general, my hope is that this tool will provide a more scientific and accurate idea of release stability and quality over time. There’s lots more to do, but I think this is a promising start. Much gratitude to kairo, calixte, chutten and others who helped build my understanding of this area.
The dashboard itself an easier thing to show than talk about, so I recorded a quick demonstration of some of the dashboard’s capabilities and published it on air mozilla:
link
Like many, I’ve been a bit worried about the Ontario election, and have been rather obsessively checking a site called the Ontario Poll Tracker.
![]()
It has nice and shiny graphs and uses authoritative language and purports to provide a scientific analysis which predicts the election. Despite this, it’s my assertion that this kind of predictive modelling is nothing more than snake oil. I keep on reminding myself that I shouldn’t take it too seriously, but haven’t been too successful so far. This blog post is a reminder to myself on why I should stop reloading that site so much, but maybe it will be helpful to others as well. As a warning, it’s not going to say anything particularly novel. If you have any kind of background in statistics at all, this is probably going to be quite boring.
First, a story. Way back when I had just graduated from university in 2003, I worked briefly at an “opinion research company”, telephoning people for various opinion surveys. It was easily the worst job I ever had, horrible for both the people doing the calling and those who were being called.
The work was mind-numbingly repetitive. Get assigned a poll. Telephone people using an autodialer, work through the script using the DOS-based software the call center was using where they would answer multiple-choice questions. Repeat as many times as you can over the course of an hour. The topics were varied, but roughly 50/50 political parties doing private polling and businesses trying to get marketing data. In either case, the questions were definitely of the “lowest common denominator” type question (i.e. “Which products are you likely to buy in the next 12 months”, “If an election were held today, would you vote for party A, B, or C?”)
One of the few benefits of tedious jobs is that they give you time to think about things. In this case, one of my distinct experiential take aways as that the results that we were getting were incredibly unrepresentative.
For a poll to be valid it is supposed to be “reasonably” reflective of the general population. Over the quantities that we’re talking about, that means anywhere from hundreds of thousands to millions of people. If we were able to truly randomly sample a small number from this group, the results are likely to be “representative of the whole” (within some confidence interval). Let’s write up a small python script to confirm this intuition:
# 100,000 random numbers between 0 and 1
>>> full_population_size = 100000
>>> full_sample = [random.random() for i in range(full_population_size)]

# average over entire result
>>> sum(full_sample) / full_population_size
0.501036568906331

# pull out 100 randomly selected values from the full sample and
# get their average
>>> random_subset_size = 100
>>> random_subset = [full_sample[i] for i in [int(random.random()*100000) for j in
                     range(random_subset_size)]]
>>> sum(random_subset) / random_subset_size
0.4924555517866068
Only a small fraction of the total population, but a result within 1% of the true value. Expressing it this way makes random sampling almost like a tautology. You probably learned this in high school. Great right?
Unfortunately, real life always comes in to disturb these assumptions, as it always does. You see, there were all sorts of factors that would affect who we would be talking to and thus get datapoints from. At that time, most of the population still had a land-line telephone but there were a wealth of other factors that meant that we weren’t getting a truly randoms sample of data. Men (at least men under 60 or so) were much less likely to answer a telephone survey than women. For general opinion surveys, we were calling at a specific time of day when most people were likely to be available — but that certainly wouldn’t apply to everyone. Some people would work night shifts, etc., etc. In our example above, this would be like taking out half the results over (say) 0.75 from our sample — the end result would tend to skew much lower than the true value.
Just for fun, let’s try doing that and see how it affects the results:
# if we take away approximately half the results with a value of
# >0.75, the population we are sampling from is reduced proportionally
>>> full_sample_with_half75_removed = [v for v in full_sample if v <= 0.75 or random.random() < 0.5]
>>> len(full_sample_with_half75_removed)
87607

# the sampled value is then proportionally skewed downwards (because
# a large percentage of the high values are no longer available)
>>> random_subset = [full_sample_with_half75_removed[i] for i in
                     [int(random.random()*len(full_sample_with_half75_removed)) for j in
                      range(random_subset_size)]
                    ]
>>> sum(random_subset)/random_subset_size
0.4585241853943395
To try and get around this problem, the opinion polling company would try to demographically restrict who we were surveying past a certain point, so that the overall sample of the poll would reasonably reflect the characteristics of the population. This probably helped, but there’s only so much you can do here. For example, if you correct for the fact that men aged 20 to 60 are less likely to answer an opinion survey, your sample is going to now consist of those weird men who do answer opinion surveys. Who knows what effect that’s going to have on your results?
I want to be clear here: this is a methodological problem. Running more opinion polls doesn’t help. Probably some samples will be more affected by errors than others, but the problem remains regardless. Actually, let’s show this trivially for our small example:
>>> skewed_averages = []
>>> for i in range(10):
...   full_sample_with_half75_removed = [v for v in full_sample if v <= 0.75 or
                                         random.random() < 0.5]
...   random_subset = [full_sample_with_half75_removed[i] for i in
          [int(random.random()*len(full_sample_with_half75_removed)) for j in
           range(random_subset_size)]]
...   skewed_averages += [sum(random_subset)/len(random_subset)]
...
>>> skewed_averages
[0.4585241853943395, 0.4271412530288919, 0.46414511969024697, 0.4360740890986547,
 0.4779021127791633, 0.38419133106708714, 0.48688298744651576, 0.41076028280889915,
 0.47975630795860363, 0.4381467970818846]
Each time we resampled from the main population and got a different result, but the end result was still one which was far off from what we know in this case was the true value (0.5). Sampling from bad data doesn’t make up for these problems, it just gives you more bad results.
Now, flash forward to 2018. Almost no one under 50 has a land-line anymore, people who have cell phones most often don’t answer to unknown callers. And don’t even get me started on how to find a representative set of people to participate in an “online panel”. What validity do polls have under these circumstances? I would say very little and probably more importantly we don’t even have a clear idea of how our modern polls are skewed.
There has been no shortage of thinking on how to correct for these problems but in my opinion it’s all just speculative and largely invalid. You can’t definitively solve the kind of uncertainty we’re talking about here by coming up with “just so” stories about how you’ve corrected for it. We might have some ideas about how our data is biased, but short of sampling the entire population and then seeing how our sampling method falls into that superset (which is impossible) there is no way of confirming that our efforts to correct for that bias were effective.
With respect to the Ontario election which I alluded to above, the one thing that I am getting from the data is that support for the NDP (across the highly unrepresentative sample used in the polls) is increasing precipitously and that for the PC’s is decreasing almost as sharply. That seems to be a real phenomenon. We don’t know whether that crosses over to the general population but it doesn’t seem unreasonable to think it does. Exactly how is another question, and I make no assertions there.
![]()
tl;dr If you don’t like the idea of Doug Ford in power, there is no reason to panic based on sites like the Ontario Poll Tracker. Spend your time doing something more productive, like convincing your friends and relatives to vote for someone who is not Conservative.
Just wanted to give a quick update on some things that have been happening with the metrics graphics since I stepped up to help with maintainership a few months ago:
- Hamilton’s back as co-maintainer! This has been especially helpful as he understands much of the historical context of metricsgraphics better than I do.
- We’ve merged in a large number of small fixes and improvements into the codebase, thanks to myself and a number of other contributors. Special shout-out to Thomas Champagne, who has contributed a large number of nifty new features.
- We moved the project from Mozilla to its own organization on github. This feels like a much better way forward for a project which is supposed to be useful far outside the bounds of Mozilla, and hopeful makes contributors feel more like the first-class citizens of the project that they actually are.
- We have a GSOC intern! As part of the Mozilla GSOC, Yunhao Zheng is going to be working on adding rich brushing/zooming support to Metrics Graphics, which should be quite useful for visualizing complex data in projects like Perfherder (Project outline, Yunhao’s proposal)