Sometimes problems are easier to solve than expected.
For the last few months I’ve been working on the front end of a new project called Mission Control, which aims to chart lots of interesting live information in something approximating realtime. Since this is a greenfield project, I thought it would make sense to use the currently-invogue framework at Mozilla (react) along with our standard visualization library, metricsgraphics.
Metricsgraphics is great, but its jquery-esque api is somewhat at odds with the react way. The obvious solution to this problem is to wrap its functionality in a react component, and a quick google search determined that several people have tried to do exactly that, the most popular one being one called (obviously) react-metrics-graphics. Unfortunately, it hadn’t been updated in quite some time and some pull requests (including ones implementing features I needed for my project) weren’t being responded to.
I expected this to be pretty difficult to resolve: I had no interaction with the author (Carter Feldman) before but based on my past experiences in free software, I was expecting stonewalling, leaving me no choice but to fork the package and give it a new name, a rather unsatisfying end result.
But, hey, let’s keep an open mind on this. What does google say about unmaintained npm packages? Oh what’s this? They actually have a policy?
tl;dr: You email the maintainer (politely) and CC support@npmjs.org about your interest in helping maintain the software. If you’re unable to come up with a resolution on your own, they will intervene.
So I tried that. It turns out that Carter was really happy to hear that Mozilla was interested in taking over maintenance of this project, and not only gave me permission to start publishing newer versions to npm, but even transferred his repository over to Mozilla (so we could preserve issue and PR history). The project’s new location is here:
In hindsight, this is obviously the most reasonable outcome and I’m not sure why I was expecting anything else. Is the node community just friendlier than other areas I’ve worked in? Have community standards improved generally? In any case, thank you Carter for a great piece of software, hopefully it will thrive in its new home. :P
Had a good all hands with the rest of Mozilla in San Francisco (at least those able and willing to attend due to the current political situation in the U.S.). I stayed a few extra days to hang out with some of my friends who had moved to S.F. On Sunday we went to Muir Woods, where I took this picture:
It occurred to me at the time that I took that photo that pretty much every sensory receptor in my optic nerve was registering the signal of some kind of life. Thousands of beings (trees, clover, moss, lichens) in turn made up of trillions upon trillions of tiny beings (cells, bacteria) all conscious and interacting with each other in ways that I can barely begin to understand.
A couple months ago, I joined the Mozilla Data Platform team, to work on our Telemetry and automated data collection services. This has been an interesting transition for me, and a natural jumping off point from my work on Perfherder. Now, instead of manipulating mere 10s of gigabytes worth of fairly regular data, I’m working with 100s of terrabytes of noisy data with a much larger number of dimensions. :P It’s been interesting so far.
One of the first things I decided to work on was improving our unit testing story around a few of our primary packages for data analysis/etl: python_moztelemetry (a library we use for running custom spark jobs against Telemetry data) and telemetry-batch-view (a set of scala jobs we run against the main telemetry data store to create a useful set of aggregations that are easily queried with tools like redash).
It turns out that these tools interact with several larger / more involved pieces than I’m used to dealing with (such as hbase and thrift). For continuous integration/automation, we already had a set of travis scripts to install and reproduce the environment needed to test these parts, but there was no straightforward way to do this locally. My third time through creating an Ubuntu virtual machine environment to reproduce this environment locally (long story), I figured it was finally time for me to investigate using something to automate that setup procedure and make it easier for new developers to get into these projects.
I hadn’t used it much before, but Docker seemed like a fairly obvious choice. Small, simple, and Linuxy? Sign me up.
I’m pretty happy with how things turned out, but there were a few caveats. Docker is more of a general purpose tool for building environments for running things, whether that be an apache webserver or a jabber messaging doohickey (whereas e.g. something like travis is basically a domain-specific language for creating and running automated tests). There were a few tricks I needed to employ to make the whole testing process smooth in both cases, which I’ll document here for posterity:
You can ADD a set of files / directories to a docker environment inside your Dockerfile, but if you want your set of tests to pick up any changes made since the environment was created, you really should mount your testing directory inside the container using the -v option.
If you need to download/install a piece of software when building the docker container, use the RUN directive instead of ADD. This will speed up rebuilding the container while you’re iterating on it (because you can take advantage of the Docker layers cache).
You almost certainly want to create a script (example) to streamline all the steps of running the tests: this will make running the tests easier for anyone wanting to contribute to your project and reduce the amount of documentation that you will have to write.
The relevant files and documentation are in the repositories linked above.
As part of the Stockwell project, I’ve been hacking on ways to make it easier for developers to diagnose failure of our tests in automation. It’s often very difficult to reproduce an intermittent failure we see in Treeherder locally since the environment is so different, but historically it has been a big hassle to get access to the machines we use in automation for various reasons.
One option that rolled out last year was the so-called one-click loaner, which enabled developers to sign out an virtual machine instance identical to the ones used to run unit tests (at least if the tests are running on Taskcluster, which is increasingly often the case), then execute their particular case with whatever extra debugging options they would find useful. This is a big step forward, but it’s still quite a bit of hassle, since it requires a bunch of manual work on the part of the developer to interact with the instance.
What if we could just re-run the particular test an arbitrary number of times with whatever options we wanted, simply by clicking on a few buttons on Treeherder? I’ve been exploring this for the first few months of 2017 and I’ve come up with a prototype which I think is ready for people to start playing with.
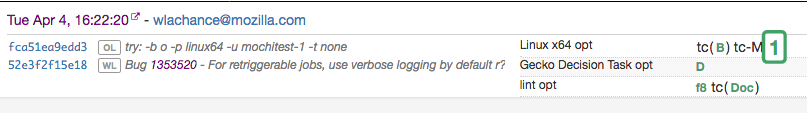
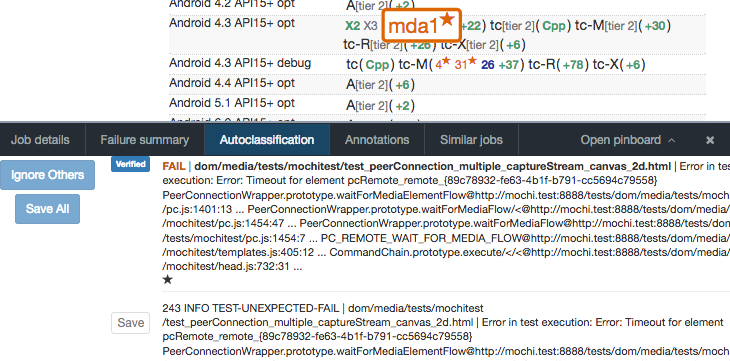
The user interface to this is pretty straightforward. Just find a job you want to retrigger in Treeherder:
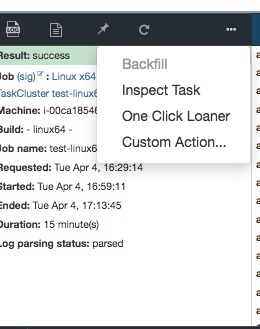
Then select the ’…’ option in the panel below and press “Custom Action…”:
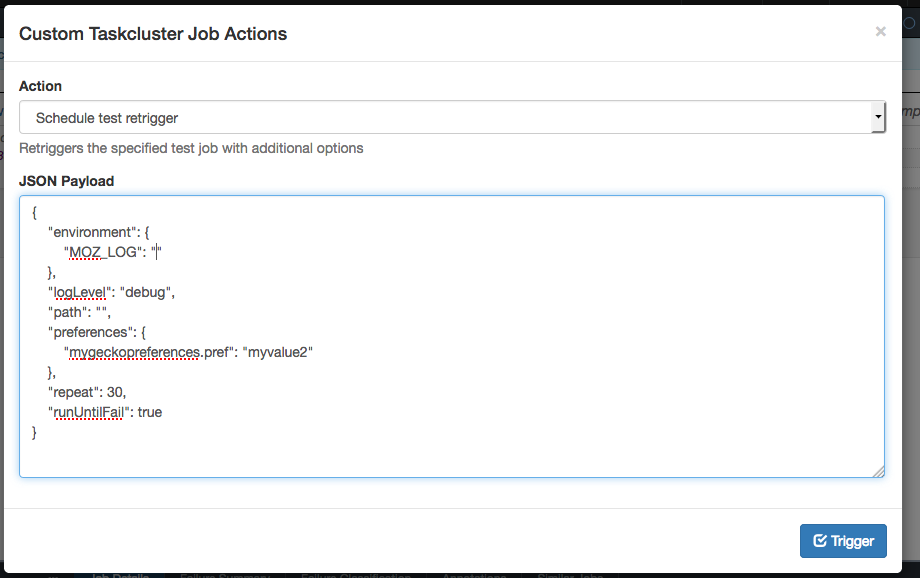
You should get a small piece of JSON to edit, which corresponds to the configuration for the retriggered job:
The main field to edit is “path”. You should set this to the name of the test you want to try retriggering. For example dom/animation/test/css-transitions/test_animation-ready.html. You can also set custom Firefox preferences and environment variables, to turn on different types of debugging.
Unfortunately as usual with a new feature at Mozilla, there are a bunch of limitations and caveats:
This depends on functionality that’s only in Taskcluster, so buildbot jobs are exempt.
No support for Android yet. In combination with the above limitation, this implies that this functionality only works on Linux (at least until other platforms are moved to Taskcluster, which hopefully isn’t that far off).
Browser chrome tests failing in mysterious ways if run repeatedly (bug 1347654)
Only reftest and mochitest are currently supported. XPCShell support is blocked by the lack of support in its harness for running a job repeatedly (bug 1347696). Web Platform Tests need the requisite support in mozharness for just setting up the tests without running them — the same issue that prevents us from debugging such tests with a one-click loaner (bug 1348833).
Aside from fixing the above limitations, the following features would also be really nifty to have:
Ability to trigger a custom job as part of a try push (i.e. not needing to retrigger off an existing job)
Run these jobs under rr, and provide a way to login and interactively debug when the problem is actually reproduced.
I am actually in the process of moving to another team @ Mozilla (more on that in another post), so I probably won’t have a ton of time to work on the above — but I’d be happy to help anyone who’s interested in developing this idea further.
A special shout out to the Taskcluster team for helping me with the development of this feature: in particular the action task implementation from Jonas Finnemann Jensen that made it possible to develop this feature in the first place.
I just added a feature to Treeherder which lets you cancel a set of jobs (say, from a botched try push) much more easily. I’m hopeful that this will be helpful in keeping our resource usage on try more under control.
It uses the “pinboard” feature of Treeherder which very few people are familiar with, so I made a very short video tutorial on how to make use of this feature and put it on the Joy of Automation channel:
Here at Mozilla, we’ve accepted that a certain amount of intermittent failure in our automated testing of Firefox is to be expected. That is, for every push, a subset of the tests that we run will fail for reasons that have nothing to do with the quality (or lack thereof) of the push itself.
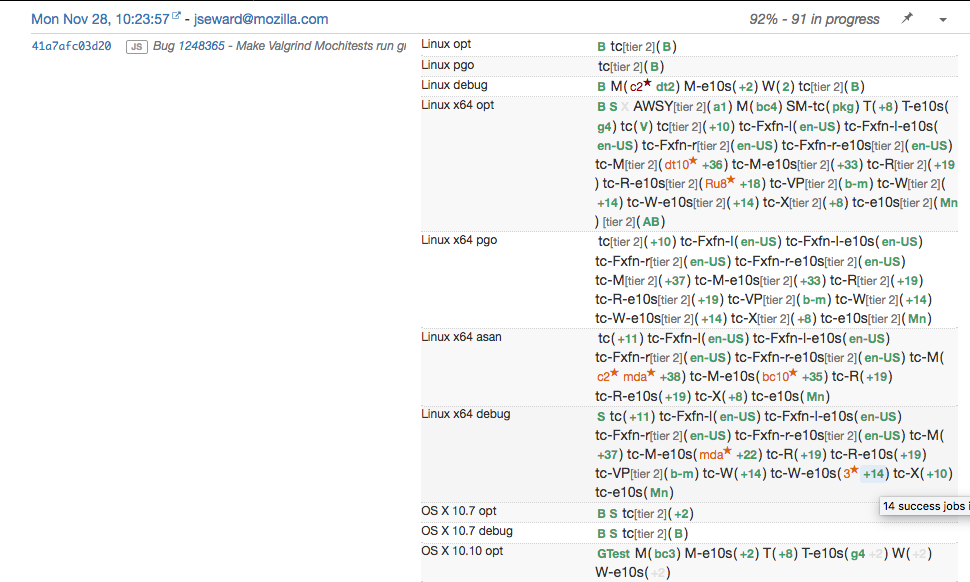
On the main integration branches that developers commit code to, we have dedicated staff and volunteers called sheriffs who attempt to distinguish these expected failures from intermittents through a manual classification process using Treeherder. On any given push, you can usually find some failed jobs that have stars beside them, this is the work of the sheriffs, indicating that a job’s failure is “nothing to worry about”:
This generally works pretty well, though unfortunately it doesn’t help developers who need to test their changes on Try, which have the same sorts of failures but no sheriffs to watch them or interpret the results. For this reason (and a few others which I won’t go into detail on here), there’s been much interest in having Treeherder autoclassify known failures.
We have a partially implemented version that attempts to do this based on structured (failure line) information, but we’ve had some difficulty creating a reasonable user interface to train it. Sheriffs are used to being able to quickly tag many jobs with the same bug. Having to go through each job’s failure lines and manually annotate each of them is much more time consuming, at least with the approaches that have been tried so far.
It’s quite possible that this is a solvable problem, but I thought it might be an interesting exercise to see how far we could get training an autoclassifier with only the existing per-job classifications as training data. With some recent work I’ve done on refactoring Treeherder’s database, getting a complete set of per-job failure line information is only a small SQL query away:
Just to give some explanation of this query, the “bug_job_map” provides a list of bugs that have been applied to jobs. The “text_log_step” and “text_log_error” tables contain the actual errors that Treeherder has extracted from the textual logs (to explain the failure). From this raw list of mappings and errors, we can construct a data structure incorporating the job, the assigned bug and the textual errors inside it. For example:
{"bug_number":1202623,"lines":["browser_private_clicktoplay.js Test timed out -","browser_private_clicktoplay.js Found a tab after previous test timed out: http:/<number><number>:<number>/browser/browser/base/content/test/plugins/plugin_test.html -","browser_private_clicktoplay.js Found a browser window after previous test timed out -","browser_private_clicktoplay.js A promise chain failed to handle a rejection: - at chrome://mochikit/content/browser-test.js:<number> - TypeError: this.SimpleTest.isExpectingUncaughtException is not a function","browser_privatebrowsing_newtab_from_popup.js Test timed out -","browser_privatebrowsing_newtab_from_popup.js Found a browser window after previous test timed out -","browser_privatebrowsing_newtab_from_popup.js Found a browser window after previous test timed out -","browser_privatebrowsing_newtab_from_popup.js Found a browser window after previous test timed out -"]}
Some quick google searching revealed that scikit-learn is a popular tool for experimenting with text classifications. They even had a tutorial on classifying newsgroup posts which seemed tantalizingly close to what we needed to do here. In that example, they wanted to predict which newsgroup a post belonged to based on its content. In our case, we want to predict which existing bug a job failure should belong to based on its error lines.
There are obviously some differences in our domain: test failures are much more regular and structured. There are lots of numbers in them which are mostly irrelevant to the classification (e.g. the “expected 12 pixels different, got 10!” type errors in reftests). Ordering of failures might matter. Still, some of the techniques used on corpora of normal text documents for training a classifier probably map nicely onto what we’re trying to do here: it seems plausible that weighting words which occur more frequently less strongly against ones that are less common would be helpful, for example, and that’s one thing their default transformers does.
In any case, I built up a small little script to download a subset of the downloaded data (from November 1st to November 23rd), used it as training data for a classifier, then tested that against another subset of test failures between November 24th and 28th.
With absolutely no tweaking whatsoever, I got an accuracy rate of 75% on the test data. That is, the algorithm chose the correct classification given the failure text 1312 times out of 1959. Not bad for a first attempt!
After getting that working, I did some initial testing to see if I could get better results by reusing some of the error ETL summary code in Treeherder we use for bug suggestions, but the results were pretty much the same.
So what’s next? This seems like a wide open area to me, but some initial areas that seem worth exploring, if we wanted to take this idea further:
Investigate cases where the autoclassification failed or had a near miss. Is there a pattern here? Is there something simple we could do, either by tweaking the input data or using a better vectorizer/tokenizer?
Have a confidence threshold for using the autoclassifier’s data. It seems likely to me that many of the cases above where we got the wrong were cases where the classifier itself wasn’t that confident in the result (vs. others). We can either present that in the user interface or avoid classifications for these cases altogether (and leave it up to a human being to make a decision on whether this is an intermittent).
Using the structured log data inside the database as input to a classifier. Structured log data here is much more regular and denser than the free text that we’re using. Even if it isn’t explicitly classified, we may well get better results by using it as our input data.
If you’d like to experiment with the data and/or code, I’ve put it up on a github repository.
Just wanted to talk about some recent performance improvements we’ve made recently to Treeherder:
Bug 1311511: Changed the repository endpoint so we don’t do 40 redundant database queries (this was generally innocuous, but could delay loading by 400ms if the database was under heavy load).
Bug 1310016: Persisted database connections across requests (this can save ~40–50ms per request, of which there can be 5–10 when loading a Treeherder page).
Bug 1308782: Don’t download job type and group information from the server to get a “sorting order” for the job lists. This was never necessary, but it’s gotten exponentially more painful as people have added job types to Treeherder (job type information is now around a megabyte of JSON these days). This saves 5–10 seconds on a typical page load.
There’s more to come, but with these changes Treeherder should be faster for everyone to load. It should be particularly noticeable on try pushes, where the last item was by far the largest bottleneck. Here’s a youtube video of the changes:
The original is on the left. The newer, faster Treeherder is on the right. Pay particular attention to how much faster the job information populates.
Moral of the story? Optimization can be helpful, but it’s better if you can avoid doing the work altogether.
For every commit to Firefox, we run a battery of builds and automated tests on the resulting source tree to make sure that the result still works and meets our correctness and performance quality criteria. This is expensive: every new push to our repository implies hundreds of hours of machine time. However, automated quality control is essential to ensure that the product that we’re shipping to users is something that we can be proud of.
But what about evaluating the quality of the product which does the building and testing? Who does that? And by what criteria would we say that our automation system is good or bad? Up to now, our procedures for this have been rather embarassingly adhoc. With some exceptions (such as OrangeFactor), our QA process amounts to motivated engineers doing a one-off analysis of a particular piece of the system, filing a few bugs, then forgetting about it. Occasionally someone will propose turning build and test automation for a specific platform on or off in mozilla.dev.planning.
I’d like to suggest that the time has come to take a more systemic approach to this class of problem. We spend a lot of money on people and machines to maintain this infrastructure, and I think we need a more disciplined approach to make sure that we are getting good value for that investment.
As a starting point, I feel like we need to pay closer attention to the following characteristics of our automation:
End-to-end times from push submission to full completion of all build and test jobs: if this gets too long, it makes the lives of all sorts of people painful — tree closures become longer when they happen (because it takes longer to either notice bustage or find out that it’s fixed), developers have to wait longer for try pushes (making them more likely to just push directly to an integration branch, causing the former problem…)
Number of machine hours consumed by the different types of test jobs: our resources are large (relatively speaking), but not unlimited. We need proper accounting of where we’re spending money and time. In some cases, resources used to perform a task that we don’t care that much about could be redeployed towards an underresourced task that we do care about. A good example of this was linux32 talos (performance tests) last year: when the question was raised of why we were doing performance testing on this specific platform (in addition to Linux64), no one could come up with a great justification. So we turned the tests off and reconfigured the machines to do Windows performance tests (where we were suffering from a severe lack of capacity).
Over the past week, I’ve been prototyping a project I’ve been calling “Infraherder” which uses the data inside Treeherder’s job database to try to answer these questions (and maybe some others that I haven’t thought of yet). You can see a hacky version of it on my github fork.
Why implement this in Treeherder you might ask? Two reasons. First, Treeherder already stores the job data in a historical archive that’s easy to query (using SQL). Using this directly makes sense over creating a new data store. Second, Treeherder provides a useful set of front-end components with which to build a UI with which to visualize this information. I actually did my initial prototyping inside an ipython notebook, but it quickly became obvious that for my results to be useful to others at Mozilla we needed some kind of real dashboard that people could dig into.
On the Treeherder team at Mozilla, we’ve found the New Relic software to be invaluable for diagnosing and fixing quality and performance problems for Treeherder itself, so I took some inspiration from it (unfortunately the problem space of our automation is not quite the same as that of a web application, so we can’t just use New Relic directly).
There are currently two views in the prototype, a “last finished” view and a “total” view. I’ll describe each of them in turn.
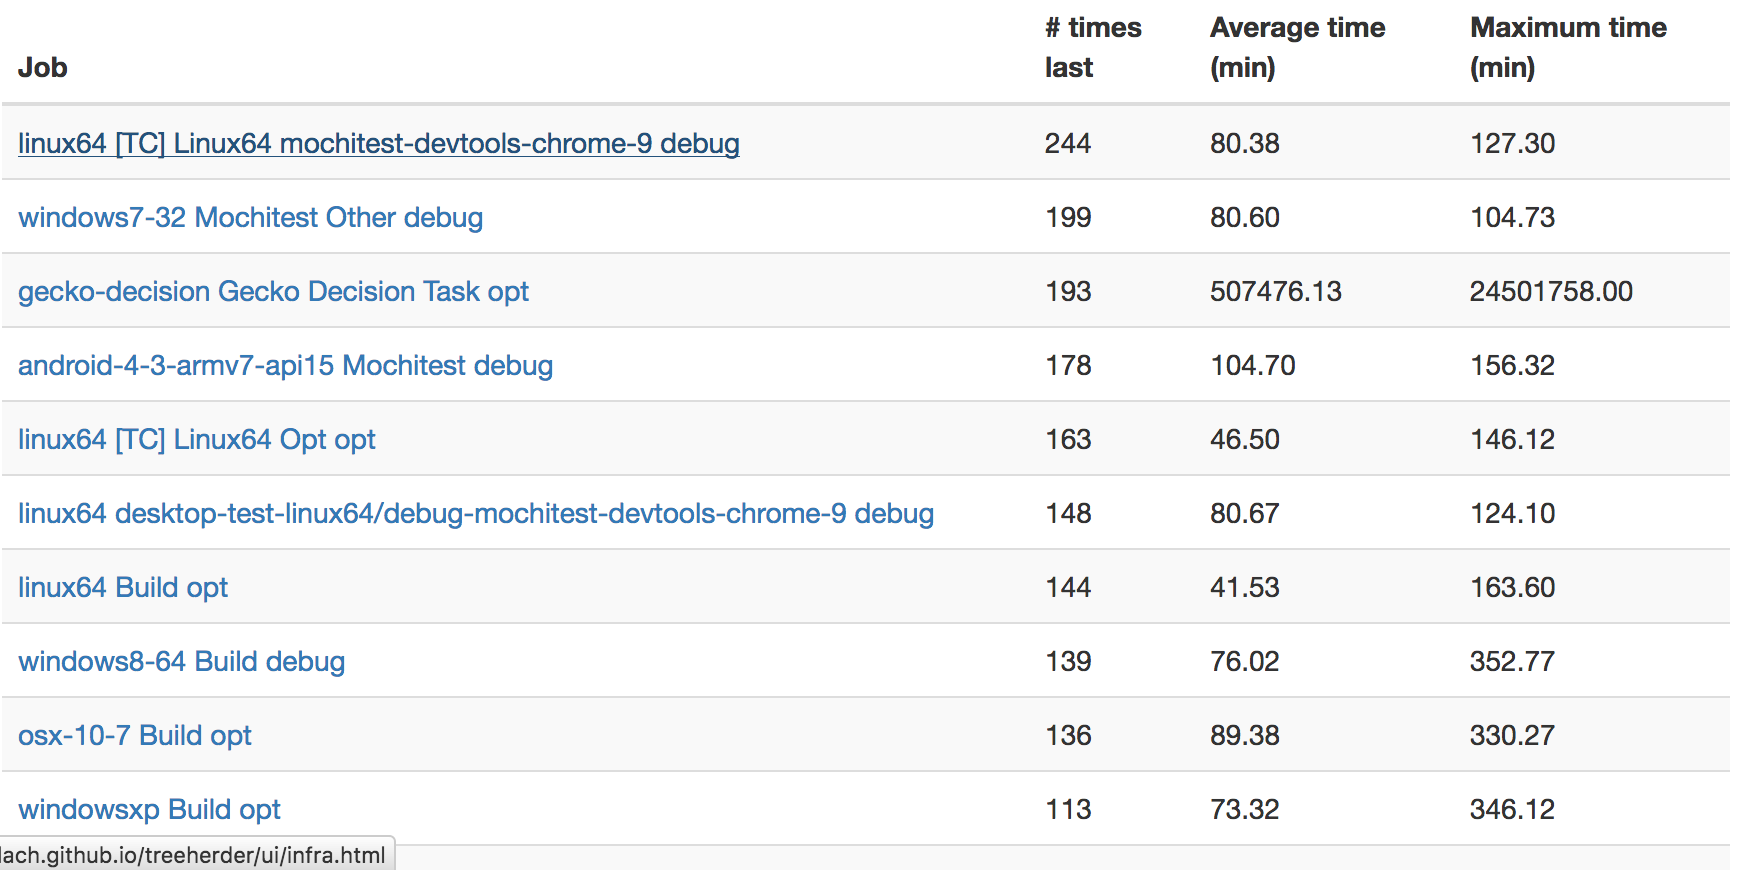
Last finished
This view shows the counts of which scheduled automation jobs were the “last” to finish. The hypothesis is that jobs that are frequently last indicate blockers to developer productivity, as they are the “long pole” in being able to determine if a push is good or bad.
Right away from this view, you can see the mochitest devtools 9 test is often the last to finish on try, with Windows 7 mochitest debug a close second. Assuming that the reasons for this are not resource starvation (they don’t appear to be), we could probably get results into the hands of developers and sheriffs faster if we split these jobs into two seperate ones. I filed bugs 1294489 and 1294706 to address these issues.
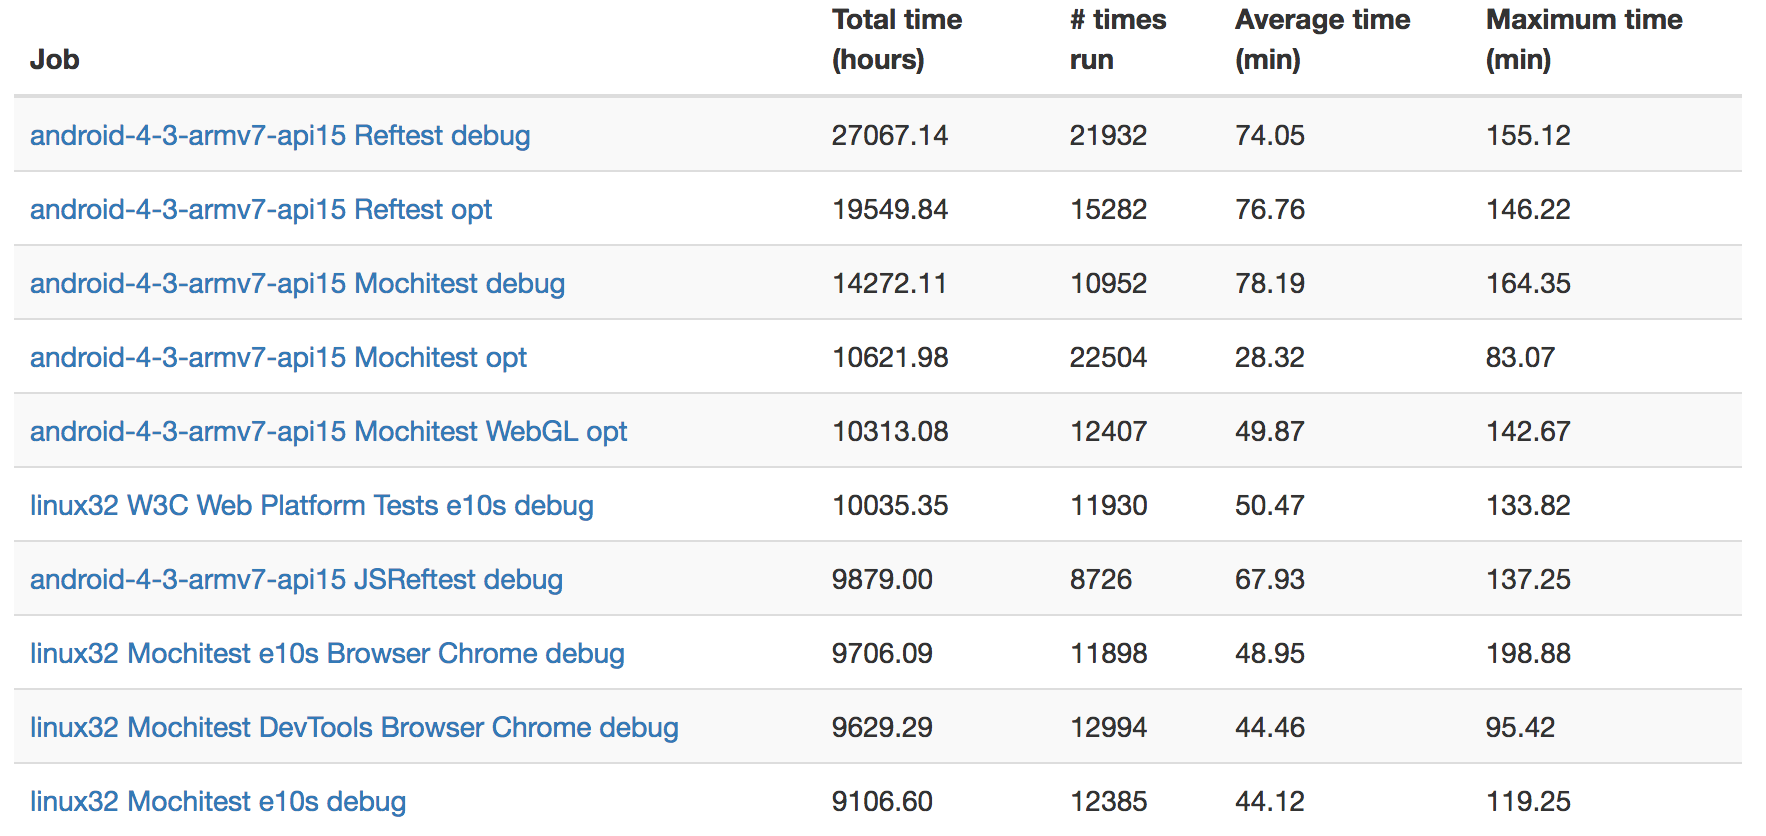
Total Time
This view just shows which jobs are taking up the most machine hours.
Probably unsurprisingly, it seems like it’s Android test jobs that are taking up most of the time here: these tests are running on multiple layers of emulation (AWS instances to emulate Linux hardware, then the already slow QEMU-based Android simulator) so are not expected to have fast runtime. I wonder if it might not be worth considering running these tests on faster instances and/or bare metal machines.
Linux32 debug tests seem to be another large consumer of resources. Market conditions make turning these tests off altogether a non-starter (see bug 1255890), but how much value do we really derive from running the debug version of linux32 through automation (given that we’re already doing the same for 64-bit Linux)?
Request for comments
I’ve created an RFC for this project on Google Docs, as a sort of test case for a new process we’re thinking of using in Engineering Productivity for these sorts of projects. If you have any questions or comments, I’d love to hear them! My perspective on this vast problem space is limited, so I’m sure there are things that I’m missing.
Following on the footsteps of Mike Ling’s amazing work on Perfherder in 2015 (he’s gone on to do a GSOC project), I got two amazing contributors to continue working on the project for a few weeks this summer as part of our quarter of contribution program: Shruti Jasoria and Roy Chiang.
Shruti started by adding a feature to the treeherder/perfherder backend (ability to enable or disable a new performance framework on a tentative basis), then went on to make all sorts of improvements to the Treeherder / Perfherder frontend, fixing bugs in the performance sheriffing frontend, updating code to use more modern standards (including a gigantic patch to enable a bunch of eslint rules and fix the corresponding problems).
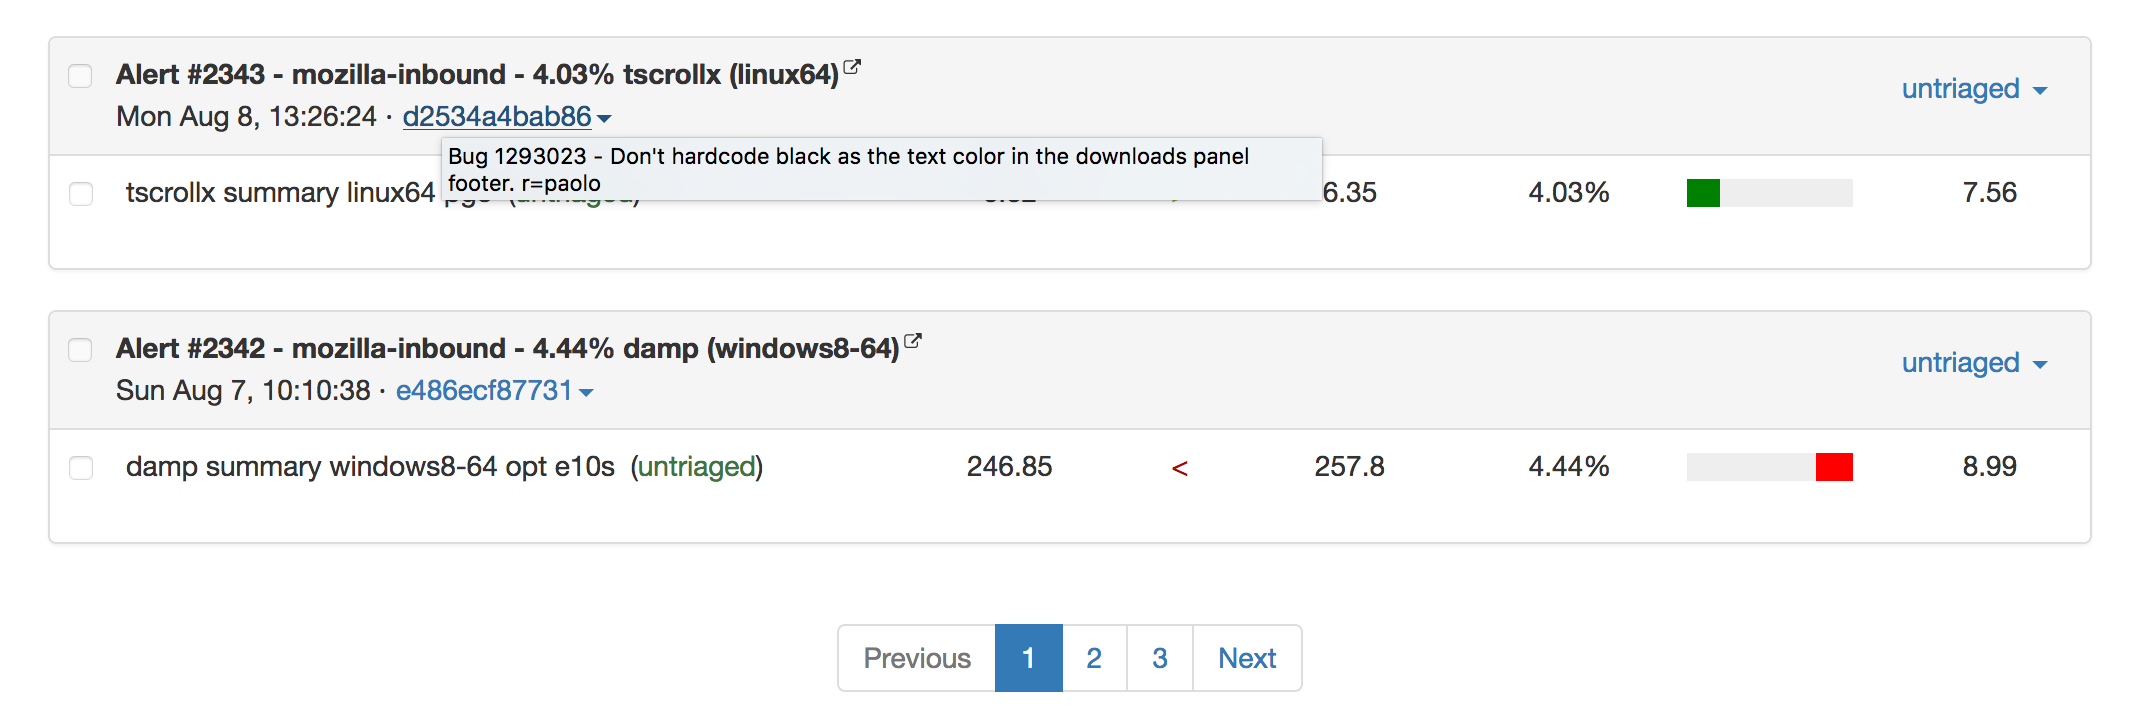
Roy worked all over the codebase, starting with some simple frontend fixes to Treeherder, moving on to fix a large number of nits in Perfherder’s alerts view. My personal favorite is the fact that we now paginate the list of alerts inside this view, which makes navigation waaaaay back into history possible:
You can see a summary of their work at these links:
Just wanted to announce that, once again, my team (Mozilla Engineering Productivity) is just about to start running another quarter of contribution — a great opportunity for newer community members to dive deep on some of the projects we’re working on, brush up on their programming and problem solving skills, and work with experienced mentors. You can find more information on this program here.
I’ve found this program to be a really great experience on both sides — it’s an opportunity for contributors to really go beyond the “good first bug” style of patches to having a really substantial impact on some of the projects that we’re working on while gaining lots of software development skills that are useful in the real world.
Once again, I’m going to be mentoring one or two people on the Perfherder project, a tool we use to measure and sheriff Firefox performance. If you’re inclined to work on some really interesting data analysis and user interface problems in Python and JavaScript, please have a look at the project page and get in touch. :)