Showing posts tagged Mozilla
Just a quick note that, as a side-effect of the work I mentioned a while ago to add telemetry to mozregression, mozregression now has a graphical Mac client! It’s a bit of a pain to install (since it’s unsigned), but likely worlds easier for the average person to get going than the command-line version. Please feel free to point people to it if you’re looking to get a regression range for a MacOS-specific problem with Firefox.
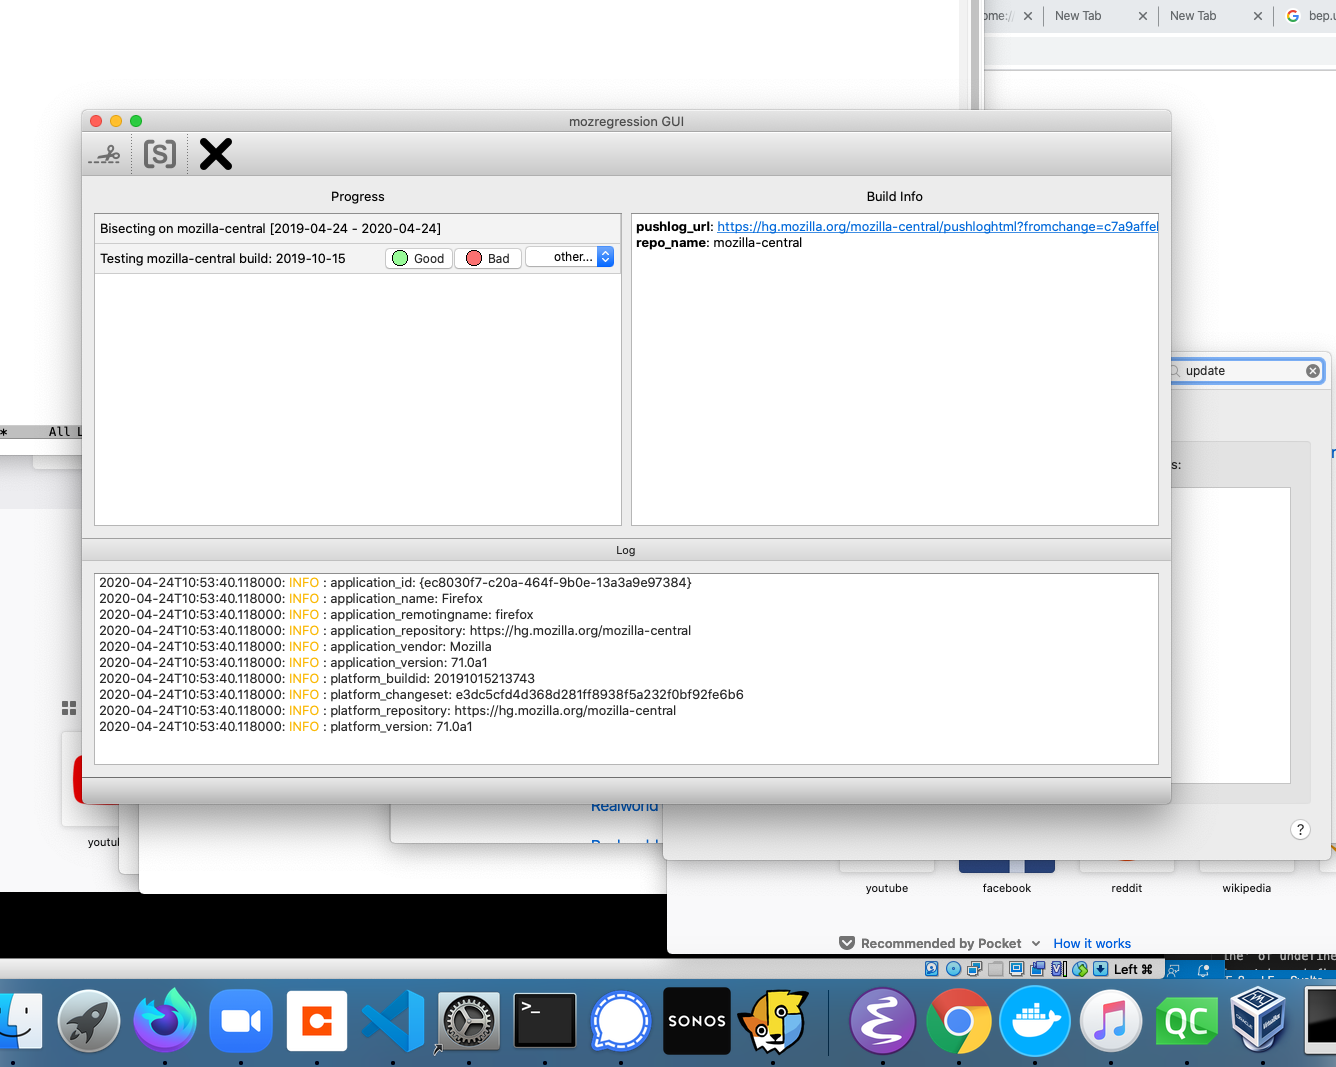
More details: The Glean Python SDK, which mozregression now uses for telemetry, requires Python 3. This provided the impetus to port the GUI itself to Python 3 and PySide2 (the modern incarnation of PyQt), which brought with it a much easier installation/development experience for the GUI on platforms like Mac and Linux.
I haven’t gotten around to producing GUI binaries for the Linux yet, but it should not be much work.
Speaking of Glean, mozregression, and Telemetry, stay tuned for more updates on that soon. It’s been an adventure!
(“This Week in Glean” is a series of blog posts that the Glean Team at Mozilla is using to try to communicate better about our work. They could be release notes, documentation, hopes, dreams, or whatever: so long as it is inspired by Glean. You can find an index of all TWiG posts online.)
This is a special guest post by non-Glean-team member William Lachance!
As I mentioned last time I talked about mozregression, I have been thinking about adding some telemetry to the system to better understand the usage of this tool, to justify some part of Mozilla spending some cycles maintaining and improving it (assuming my intuition that this tool is heavily used is confirmed).
Coincidentally, the Telemetry client team has been working on a new library for measuring these types of things in a principled way called Glean, which even has python bindings! Using this has the potential in saving a lot of work: not only does Glean provide a framework for submitting data, our backend systems are automatically set up to process data submitted via into Glean into BigQuery tables, which can then easily be queried using tools like sql.telemetry.mozilla.org.
I thought it might be useful to go through some of what I’ve been exploring, in case others at Mozilla are interested in instrumenting their pet internal tools or projects. If this effort is successful, I’ll distill these notes into a tutorial in the Glean documentation.
Initial steps: defining pings and metrics
The initial step in setting up a Glean project of any type is to define explicitly the types of pings and metrics. You can look at a “ping” as being a small bucket of data submitted by a piece of software in the field. A “metric” is something we’re measuring and including in a ping.
Most of the Glean documentation focuses on browser-based use-cases where we might want to sample lots of different things on an ongoing basis, but for mozregression our needs are considerably simpler: we just want to know when someone has used it along with a small number of non-personally identifiable characteristics of their usage, e.g. the mozregression version number and the name of the application they are bisecting.
Glean has the concept of event pings, but it seems like those are there more for a fine-grained view of what’s going on during an application’s use. So let’s define a new ping just for ourselves, giving it the unimaginative name “usage”. This goes in a file called pings.yaml:
---
$schema: moz://mozilla.org/schemas/glean/pings/1-0-0

usage:
  description: >
    A ping to record usage of mozregression
  include_client_id: true
  notification_emails:
    - wlachance@mozilla.com
  bugs:
    - http://bugzilla.mozilla.org/123456789/
  data_reviews:
    - http://example.com/path/to/data-review
We also need to define a list of things we want to measure. To start with, let’s just test with one piece of sample information: the app we’re bisecting (e.g. “Firefox” or “Gecko View Example”). This goes in a file called metrics.yaml:
---
$schema: moz://mozilla.org/schemas/glean/metrics/1-0-0

usage:
  app:
    type: string
    description: >
      The name of the app being bisected
    notification_emails:
      - wlachance@mozilla.com
    bugs:
      - https://bugzilla.mozilla.org/show_bug.cgi?id=1581647
    data_reviews:
      - http://example.com/path/to/data-review
    expires: never
    send_in_pings:
      - usage
The data_reviews sections in both of the above are obviously bogus, we will need to actually get data review before landing and using this code, to make sure that we’re in conformance with Mozilla’s data collection policies.
Testing it out
But in the mean time, we can test our setup with the Glean debug pings viewer by setting a special tag (mozregression-test-tag) on our output. Here’s a small python script which does just that:
from pathlib import Path
from glean import Glean, Configuration
from glean import (load_metrics,
                   load_pings)

mozregression_path = Path.home() / '.mozilla2' / 'mozregression'

Glean.initialize(
    application_id="mozregression",
    application_version="0.1.1",
    upload_enabled=True,
    configuration=Configuration(
      ping_tag="mozregression-test-tag"
    ),
    data_dir=mozregression_path / "data"
)
Glean.set_upload_enabled(True)

pings = load_pings("pings.yaml")
metrics = load_metrics("metrics.yaml")

metrics.usage.app.set("reality")
pings.usage.submit()
Running this script on my laptop, I see that a respectable JSON payload was delivered to and processed by our servers:
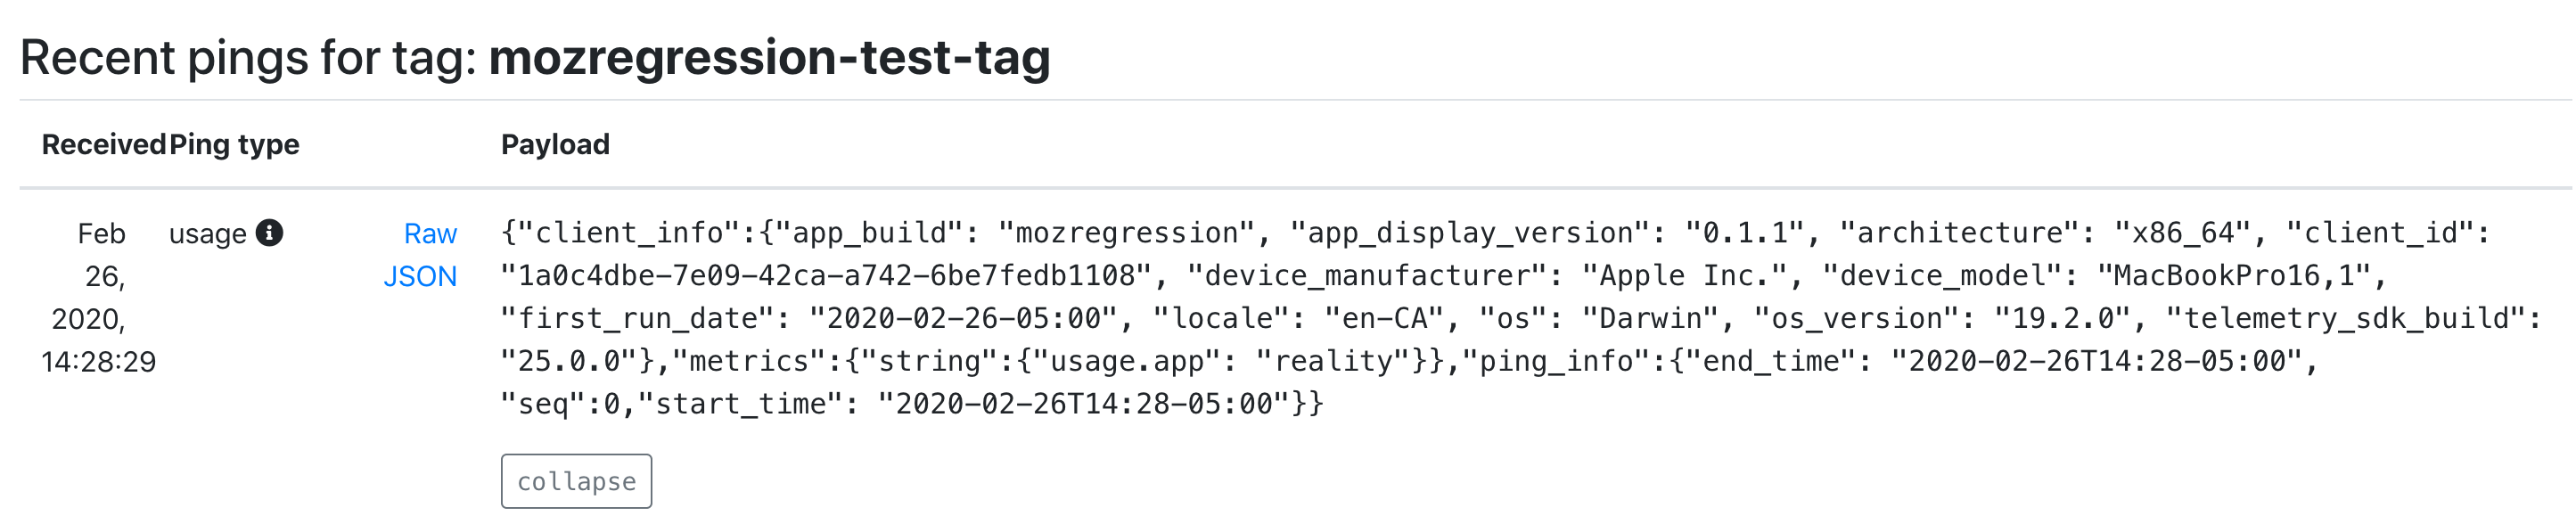
As you can see, we’re successfully processing both the “version” number of mozregression, some characteristics of the machine sending the information (my MacBook in this case), as well as our single measure. We also have a client id, which should tell us roughly how many distinct installations of mozregression are sending pings. This should be more than sufficient for an initial “mozregression usage dashboard”.
Next steps
There are a bunch of things I still need to work through before landing this inside mozregression itself. Notably, the Glean python bindings are python3-only, so we’ll need to port the mozregression GUI to python 3 before we can start measuring usage there. But I’m excited at how quickly this work is coming together: stay tuned for part 2 in a few weeks.
Lately the data engineering team has been looking into productionizing (i.e. running in Airflow) a bunch of models that the data science team has been producing. This often involves languages and environments that are a bit outside of our comfort zone — for example, the next version of Mission Control relies on the R-stan library to produce a model of expected crash behaviour as Firefox is released.
To make things as simple and deterministic as possible, we’ve been building up Docker containers to run/execute this code along with their dependencies, which makes things nice and reproducible. My initial thought was to use just the language-native toolchains to build up my container for the above project, but quickly found a number of problems:
- For local testing, Docker on Mac is slow: when doing a large number of statistical calculations (as above), you can count on your testing iterations taking 3 to 4 (or more) times longer.
- On initial setup, the default R packaging strategy is to have the user of a package like R-stan recompile from source. This can take forever if you have a long list of dependencies with C-compiled extensions (pretty much a given if you’re working in the data space): rebuilding my initial docker environment for missioncontrol-v2 took almost an hour. This isn’t just a problem for local development: it also makes continuous integration using a service like Circle or Travis expensive and painful.
I had been vaguely aware of Conda for a few years, but didn’t really understand its value proposition until I started working on the above project: why bother with a heavyweight package manager when you already have Docker to virtualize things? The answer is that it solves both of the above problems: for local development, you can get something more-or-less identical to what you’re running inside Docker with no performance penalty whatsoever. And for building the docker container itself, Conda’s package repository contains pre-compiled versions of all the dependencies you’d want to use for something like this (even somewhat esoteric libraries like R-stan are available on conda-forge), which brought my build cycle times down to less than 5 minutes.
tl;dr: If you have a bunch of R / python code you want to run in a reproducible manner, consider Conda.
For the last year, we’ve been gradually migrating our backend Telemetry systems from AWS to GCP. I’ve been helping out here and there with this effort, most recently porting a job we used to detect slow tab spinners in Firefox nightly, which produced a small dataset that feeds a small adhoc dashboard which Mike Conley maintains. This was a relatively small task as things go, but it highlighted some features and improvements which I think might be broadly interesting, so I decided to write up a small blog post about it.
Essentially all this dashboard tells you is what percentage of the Firefox nightly population saw a tab spinner over the past 6 months. And of those that did see a tab spinner, what was the severity? Essentially we’re just trying to make sure that there are no major regressions of user experience (and also that efforts to improve things bore fruit):
![]()
Pretty simple stuff, but getting the data necessary to produce this kind of dashboard used to be anything but trivial: while some common business/product questions could be answered by a quick query to clients_daily, getting engineering-specific metrics like this usually involved trawling through gigabytes of raw heka encoded blobs using an Apache Spark cluster and then extracting the relevant information out of the telemetry probe histograms (in this case, FX_TAB_SWITCH_SPINNER_VISIBLE_MS and FX_TAB_SWITCH_SPINNER_VISIBLE_LONG_MS) contained therein.
The code itself was rather complicated (take a look, if you dare) but even worse, running it could get very expensive. We had a 14 node cluster churning through this script daily, and it took on average about an hour and a half to run! I don’t have the exact cost figures on hand (and am not sure if I’d be authorized to share them if I did), but based on a back of the envelope sketch, this one single script was probably costing us somewhere on the order of $10-$40 a day (that works out to between $3650-$14600 a year).
With our move to BigQuery, things get a lot simpler! Thanks to the combined effort of my team and data operations[1], we now produce “stable” ping tables on a daily basis with all the relevant histogram data (stored as JSON blobs), queryable using relatively vanilla SQL. In this case, the data we care about is in telemetry.main (named after the main ping, appropriately enough). With the help of a small JavaScript UDF function, all of this data can easily be extracted into a table inside a single SQL query scheduled by sql.telemetry.mozilla.org.
CREATE TEMP FUNCTION
  udf_js_json_extract_highest_long_spinner (input STRING)
  RETURNS INT64
  LANGUAGE js AS """
    if (input == null) {
      return 0;
    }
    var result = JSON.parse(input);
    var valuesMap = result.values;
    var highest = 0;
    for (var key in valuesMap) {
      var range = parseInt(key);
      if (valuesMap[key]) {
        highest = range > 0 ? range : 1;
      }
    }
    return highest;
""";

SELECT build_id,
sum (case when highest >= 64000 then 1 else 0 end) as v_64000ms_or_higher,
sum (case when highest >= 27856 and highest < 64000 then 1 else 0 end) as v_27856ms_to_63999ms,
sum (case when highest >= 12124 and highest < 27856 then 1 else 0 end) as v_12124ms_to_27855ms,
sum (case when highest >= 5277 and highest < 12124 then 1 else 0 end) as v_5277ms_to_12123ms,
sum (case when highest >= 2297 and highest < 5277 then 1 else 0 end) as v_2297ms_to_5276ms,
sum (case when highest >= 1000 and highest < 2297 then 1 else 0 end) as v_1000ms_to_2296ms,
sum (case when highest > 0 and highest < 50 then 1 else 0 end) as v_0ms_to_49ms,
sum (case when highest >= 50 and highest < 100 then 1 else 0 end) as v_50ms_to_99ms,
sum (case when highest >= 100 and highest < 200 then 1 else 0 end) as v_100ms_to_199ms,
sum (case when highest >= 200 and highest < 400 then 1 else 0 end) as v_200ms_to_399ms,
sum (case when highest >= 400 and highest < 800 then 1 else 0 end) as v_400ms_to_799ms,
count(*) as count
from
(select build_id, client_id, max(greatest(highest_long, highest_short)) as highest
from
(SELECT
    SUBSTR(application.build_id, 0, 8) as build_id,
    client_id,
    udf_js_json_extract_highest_long_spinner(payload.histograms.FX_TAB_SWITCH_SPINNER_VISIBLE_LONG_MS) AS highest_long,
    udf_js_json_extract_highest_long_spinner(payload.histograms.FX_TAB_SWITCH_SPINNER_VISIBLE_MS) as highest_short
FROM telemetry.main
WHERE
    application.channel='nightly'
    AND normalized_os='Windows'
    AND application.build_id > FORMAT_DATE("%Y%m%d", DATE_SUB(CURRENT_DATE(), INTERVAL 2 QUARTER))
    AND DATE(submission_timestamp) >= DATE_SUB(CURRENT_DATE(), INTERVAL 2 QUARTER))
group by build_id, client_id) group by build_id;
In addition to being much simpler, this new job is also way cheaper. The last run of it scanned just over 1 TB of data, meaning it cost us just over $5. Not as cheap as I might like, but considerably less expensive than before: I’ve also scheduled it to only run once every other day, since Mike tells me he doesn’t need this data any more often than that.
[1] I understand that Jeff Klukas, Frank Bertsch, Daniel Thorn, Anthony Miyaguchi, and Wesley Dawson are the principals involved - apologies if I’m forgetting someone.
Just a note that I’ve decided to step back from metrics graphics maintenance for the time being, which means that the project is essentially unowned. This has sort of been the case for a while, but I figured I should probably make it official.
If you follow the link to the metrics graphics repository, you’ll note that the version has been bumped to “3.0-alpha3”. I was this close to making one last new release this afternoon but decided I didn’t want to potentially break existing users who were fine using the last “official” version (v3.0 bumps the version of d3 used to “5”, among other breaking changes). I’d encourage people who want to continue using the library to make a fork and publish a copy under their user or organization name on npm.
For those who are still wondering, yup, I am still maintaining mozregression, though increasingly reluctantly. Given how important this project is to the development of Firefox (getting a regression window using mozregression is standard operating procedure whenever a new bug is reported in Firefox), it feels like this project is pretty vital, so I continue out of some sense of obligation — but really, someone more interested in Mozilla’a build, automation and testing systems would be better suited to this task: over the past few years, my interests/focus have shifted away from this area to building up Mozilla’s data storage and visualization platform.
This post will describe some of the things that have happened in the last year and where I see the project going. My hope is to attract some new blood to add some needed features to the project and maybe take on some of the maintainership duties.
python 3
The most important update is that, as of today, the command-line version of mozregression (v3.0.1) should work with python 3.5+. modernize did most of the work for us, though there were some unit tests that needed updating: special thanks to @gloomy-ghost for helping with that.
For now, we will continue to support python 2.7 in parallel, mainly because the GUI has not yet been ported to python 3 (more on that later) and we have CI to make sure it doesn’t break.
other updates
The last year has mostly been one of maintenance. Thanks in particular to Ian Moody (:kwan) for his work throughout the year — including patches to adapt mozregression support to our new updates policy and shippable builds (bug 1532412), and Kartikaya Gupta (:kats) for adding support for bisecting the GeckoView example app (bug 1507225).
future work
There are a bunch of things I see us wanting to add or change with mozregression over the next year or so. I might get to some of these if I have some spare cycles, but probably best not to count on it:
- Port the mozregression GUI to Python 3 (bug 1581633) As mentioned above, the command-line client works with python 3, but we have yet to port the GUI. We should do that. This probably also entails porting the GUI to use PyQT5 (which is pip-installable and thus much easier to integrate into a CI process), see bug 1426766.
- Make self-contained GUI builds available for MacOS X (bug 1425105) and Linux (bug 1581643).
- Improve our mechanism for producing a standalone version of the GUI in general. We’ve used cx_Freeze which mostly works ok, but has a number of problems (e.g. it pulls in a bunch of unnecessary dependencies, which bloats the size of the installer). Upgrading the GUI to use python 3 may alleviate some of these issues, but it might be worth considering other options in this space, like Gregory Szorc’s pyoxidizer.
- Add some kind of telemetry to mozregression to measure usage of this tool (bug 1581647). My anecdotal experience is that this tool is pretty invaluable for Firefox development and QA, but this is not immediately apparent to Mozilla’s leadership and it’s thus very difficult to convince people to spend their cycles on maintaining and improving this tool. Field data may help change that story.
- Supporting new Mozilla products which aren’t built (entirely) out of mozilla-central, most especially Fenix (bug 1556042) and Firefox Reality (bug 1568488). This is probably rather involved (mozregression has a big pile of assumptions about how the builds it pulls down are stored and organized) but that doesn’t mean that this work isn’t necessary.
If you’re interested in working on any of the above, please feel free to dive in on one of the above bugs. I can’t offer formal mentorship, but am happy to help out where I can.
I’ve been a bit bad about updating this blog over the past year or so, though this hasn’t meant there haven’t been things to talk about. For the next couple weeks, I’m going to try to give some updates on the projects I have been spending time on in the past year, both old and new. I’m going to begin with some of the less-loved things I’ve been working on, partially in an attempt to motivate some forward-motion on things that I believe are rather important to Mozilla.
More to come.
Last week, Brendan Colloran announced Iodide, a new take on scientific collaboration and reporting that I’ve been really happy to contribute to over the past year-and-a-bit. I’ve been describing it to people I meet as kind of "glitch meets jupyter " but that doesn’t quite do it justice. I’d recommend reading Brendan’s blog post (and taking a look at our demonstration site) to get the full picture.
One question that I’ve heard asked (including on Brendan’s post) is why we chose a rather conventional and old technology (Django) for the server backend. Certainly, Iodide has not been shy about building with relatively new or experimental technologies for other parts (e.g. Python on WebAssembly for the notebooks, React/Redux for the frontend). Why not complete the cycle by using a new-fangled JavaScript web server like, I don’t know, NestJS? And while we’re at it, what’s with iodide’s ridiculous REST API? Don’t you know GraphQL is the only legitimate way to expose your backend to the world in 2019?
The great urban theorist of the twentieth century, Jane Jacobs has a quote I love:
“Old ideas can sometimes use new buildings. New ideas must use old buildings.”
Laura Thompson (an engineering director at Mozilla) has restated this wisdom in a software development context as “Build exciting things with boring technologies”.
It so happened that the server was not an area Iodide was focusing on for innovation (at least initially), so it made much, much more sense to use something proven and battle-tested for the server side deployment. I’d used Django for a number of projects at Mozilla before this one (Treeherder/Perfherder and Mission Control) and have been wildly impressed by the project’s excellent documentation, database access layer, and support for building a standardized API via the Django REST Framework add-on. Not to mention the fact that so much of Mozilla’s in-house ops and web development expertise is based around this framework (I could name off probably 5 or 6 internal business systems based around the Django stack, in addition to Treeherder), so deploying Iodide and getting help building it would be something of a known quantity.
Only slightly more than half a year since I began work on the iodide server, we now have both a publicly accessible site for others to experiment with and an internal one for Mozilla’s business needs. It’s hard to say what would have happened had I chosen something more experimental to build Iodide’s server piece, but at the very least there would have been a substantial learning curve involved — in addition to engineering effort to fill in the gaps where the new technology is not yet complete — which would have meant less time to innovate where it really mattered. Django’s database migration system, for example, took years to come to fruition and I’m not aware of anything comparable in the world of JavaScript web frameworks.
As we move ahead, we may find places where applying new backend server technologies makes sense. Heck, maybe we’ll chose to rewrite the whole thing at some point. But to get to launch, chosing a bunch of boring, tested software for this portion of Iodide was (in my view) absolutely the right decision and I make no apologies for it.
One of my favorite parts about Mozilla is mentoring and working alongside third party contributors. Somewhat surprisingly since I work on internal tools, I’ve had a fair amount of luck finding people to help work on projects within my purview: mozregression, perfherder, metrics graphics, and others have all benefited from the contributions of people outside of Mozilla.
In most cases (a notable exception being metrics graphics), these have been internal-tooling projects used by others to debug, develop, or otherwise understand the behaviour of Firefox. On the face of it, none of the things I work on are exactly “high profile cutting edge stuff” in the way, say, Firefox or the Rust Programming Language are. So why do they bother? The exact formula varies depending on contributor, but I think it usually comes down to some combination of these two things:
- A desire to learn and demonstrate competence with industry standard tooling (the python programming language, frontend web development, backend databases, “big data” technologies like Parquet, …).
- A desire to work with and gain recognition inside of a community of like-minded people.
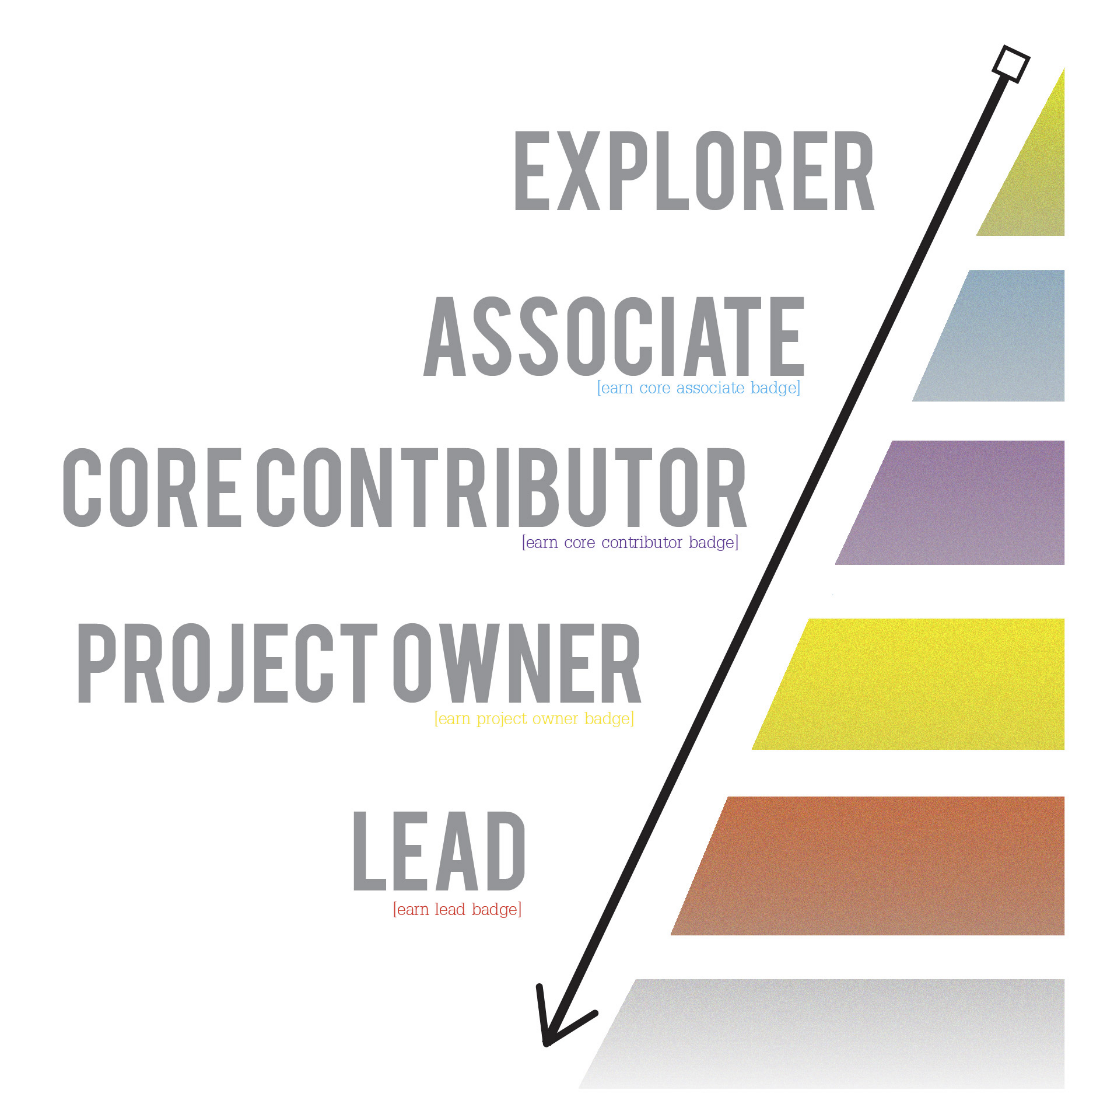
Pretty basic, obvious stuff — there is an appeal here to basic human desires like the need for security and a sense of belonging. Once someone’s “in the loop”, so to speak, generally things take care of themselves. The real challenge, I’ve found, is getting people from the “I am potentially interested in doing something with Mozilla internal tools” to the stage that they are confident and competent enough to work in a reasonably self-directed way. When I was on the A-Team, we classified this transition in terms of a commitment curve:
![]()
prototype commitment curve graphic by Steven Brown
The hardest part, in my experience, is the initial part of that curve. At this point, people are just dipping their toe in the water. Some may not have a ton of experience with software development yet. In other cases, my projects may just not be the right fit for them. But of course, sometimes there is a fit, or at least one could be developed! What I’ve found most helpful is “clearing a viable path” forward for the right kind of contributor. That is, some kind of initial hypothesis of what a successful contribution experience would look like as a new person transitions from “explorer” stage in the chart above to “associate”.
I don’t exactly have a perfect template for what “clearing a path” looks like in every case. It depends quite a bit on the nature of the contributor. But there are some common themes that I’ve found effective:
First, provide good, concise documentation both on the project’s purpose and vision and how to get started easily and keep it up to date. For projects with a front-end web component, I try to decouple the front end parts from the backend services so that people can yarn install && yarn start their way to success. Being able to see the project in action quickly (and not getting stuck on some mundane getting started step) is key in maintaining initial interest.
Second, provide a set of good starter issues (sometimes called “good first bugs”) for people to work on. Generally these would be non-critical-path type issues that have straightforward instructions to resolve and fix. Again, the idea here is to give people a sense of quick progress and resolution, a “yes I can actually do this” sort of feeling. But be careful not to let a contributor get stuck here! These bugs take a disproportionate amount of effort to file and mentor compared to their actual value — the key is to progress the contributor to the next level once it’s clear they can handle the basics involved in solving such an issue (checking out the source code, applying a fix, submitting a patch, etc). Otherwise you’re going to feel frustrated and wonder why you’re on an endless treadmill of writing up trivial bugs.
Third, once a contributor has established themselves by fixing a few of these simple issues, I try to get to know them a little better. Send them an email, learn where they’re from, invite them to chat on the project channel if they can. At the same time, this is an opportunity to craft a somewhat larger piece of work (a sort of mini-project) that they can do, tailored to the interests. For example, a new contributor on the Mission Control has recently been working on adding Jest tests to the project — I provided some basic guidance of things to look at, but did not dictate exactly how to perform the task. They figured that out for themselves.
As time goes by, you just continue this process. Depending on the contributor, they may start coming up with their own ideas for how a project might be improved or they might still want to follow your lead (or that of the team), but at the least I generally see an improvement in their self-directedness and confidence after a period of sustained contribution. In either case, the key to success remains the same: sustained and positive communication and sharing of goals and aspirations, making sure that both parties are getting something positive out of the experience. Where possible, I try to include contributors in team meetings. Where there’s an especially close working relationship (e.g. Google Summer of Code). I try to set up a weekly one on one. Regardless, I make reviewing code, answering questions, and providing suggestions on how to move forward a top priority (i.e. not something I’ll leave for a few days). It’s the least I can do if someone is willing to take time out to contribute to my project.
If this seems similar to the best practices for how members of a team should onboard each other and work together, that’s not really a coincidence. Obviously the relationship is a little different because we’re not operating with a formal managerial structure and usually the work is unpaid: I try to bear that mind and make double sure that contributors are really getting some useful skills and habits that they can take with them to future jobs and other opportunities, while also emphasizing that their code contributions are their own, not Mozilla’s. So far it seems to have worked out pretty well for all concerned (me, Mozilla, and the contributors).
Just a quick announcement that the first “production-ready” version of Mission Control just went live yesterday, at this easy-to-remember URL:
https://missioncontrol.telemetry.mozilla.org
For those not yet familiar with the project, Mission Control aims to track release stability and quality across Firefox releases. It is similar in spirit to arewestableyet and other crash dashboards, with the following new and exciting properties:
- Uses the full set of crash counts gathered via telemetry, rather than the arbitrary sample that users decide to submit to crash-stats
- Results are available within minutes of ingestion by telemetry (although be warned initial results for a release always look bad)
- The denominator in our crash rate is usage hours, rather than the probably-incorrect calculation of active-daily-installs used by arewestableyet (not a knock on the people who wrote that tool, there was nothing better available at the time)
- We have a detailed breakdown of the results by platform (rather than letting Windows results dominate the overall rates due to its high volume of usage)
In general, my hope is that this tool will provide a more scientific and accurate idea of release stability and quality over time. There’s lots more to do, but I think this is a promising start. Much gratitude to kairo, calixte, chutten and others who helped build my understanding of this area.
The dashboard itself an easier thing to show than talk about, so I recorded a quick demonstration of some of the dashboard’s capabilities and published it on air mozilla:
link