Showing posts tagged Mozilla
Just a quick note that I’ll shortly be travelling from the frozen land of Montreal, Canada to Japan and Taiwan over the next week, with no particular agenda other than to explore and meet people. If any Mozillians are interested in meeting up for food or drink, and discussion of FirefoxOS performance, Eideticker, entropy or anything else, feel free to contact me at wrlach@gmail.com.
Exact itinerary:
- Thu Mar 20 : Sat Mar 22: Tokyo, Japan
- Sat Mar 22 : Tue Mar 25: Kyoto, Japan
- Tue Mar 25 : Thu Mar 27: Tokyo, Japan
- Thu Mar 27 : Sun Mar 30: Taipei, Taiwan
I will also be in Taipei the week of the March 31st, though I expect most of my time to be occupied with discussions/activities inside the Taipei office about FirefoxOS performance matters (the Firefox performance team is having a work week there, and I’m tagging along to talk about / hack on Eideticker and other automation stuff).
[ For more information on the Eideticker software I’m referring to, see this entry ]
So recently I’ve been exploring new and different methods of measuring things that we care about on FirefoxOS — like startup time or amount of checkerboarding. With Android, where we have a mostly clean signal, these measurements were pretty straightforward. Want to measure startup times? Just capture a video of Firefox starting, then compare the frames pixel by pixel to see how much they differ. When the pixels aren’t that different anymore, we’re “done”. Likewise, to measure checkerboarding we just calculated the areas of the screen where things were not completely drawn yet, frame-by-frame.
On FirefoxOS, where we’re using a camera to measure these things, it has not been so simple. I’ve already discussed this with respect to startup time in a previous post. One of the ideas I talk about there is “entropy” (or the amount of unique information in the frame). It turns out that this is a pretty deep concept, and is useful for even more things than I thought of at the time. Since this is probably a concept that people are going to be thinking/talking about for a while, it’s worth going into a little more detail about the math behind it.
The wikipedia article on information theoretic entropy is a pretty good introduction. You should read it. It all boils down to this formula:

You can see this section of the wikipedia article (and the various articles that it links to) if you want to break down where that comes from, but the short answer is that given a set of random samples, the more different values there are, the higher the entropy will be. Look at it from a probabilistic point of view: if you take a random set of data and want to make predictions on what future data will look like. If it is highly random, it will be harder to predict what comes next. Conversely, if it is more uniform it is easier to predict what form it will take.
Another, possibly more accessible way of thinking about the entropy of a given set of data would be “how well would it compress?”. For example, a bitmap image with nothing but black in it could compress very well as there’s essentially only 1 piece of unique information in it repeated many times — the black pixel. On the other hand, a bitmap image of completely randomly generated pixels would probably compress very badly, as almost every pixel represents several dimensions of unique information. For all the statistics terminology, etc. that’s all the above formula is trying to say.
So we have a model of entropy, now what? For Eideticker, the question is — how can we break the frame data we’re gathering down into a form that’s amenable to this kind of analysis? The approach I took (on the recommendation of this article) was to create a histogram with 256 bins (representing the number of distinct possibilities in a black & white capture) out of all the pixels in the frame, then run the formula over that. The exact function I wound up using looks like this:
def _get_frame_entropy((i, capture, sobelized)):
    frame = capture.get_frame(i, True).astype('float')
    if sobelized:
        frame = ndimage.median_filter(frame, 3)

        dx = ndimage.sobel(frame, 0)  # horizontal derivative
        dy = ndimage.sobel(frame, 1)  # vertical derivative
        frame = numpy.hypot(dx, dy)  # magnitude
        frame *= 255.0 / numpy.max(frame)  # normalize (Q&D)

    histogram = numpy.histogram(frame, bins=256)[0]
    histogram_length = sum(histogram)
    samples_probability = [float(h) / histogram_length for h in histogram]
    entropy = -sum([p * math.log(p, 2) for p in samples_probability if p != 0])

    return entropy
[Context]
The “sobelized” bit allows us to optionally convolve the frame with a sobel filter before running the entropy calculation, which removes most of the data in the capture except for the edges. This is especially useful for FirefoxOS, where the signal has quite a bit of random noise from ambient lighting that artificially inflate the entropy values even in places where there is little actual “information”.
This type of transformation often reveals very interesting information about what’s going on in an eideticker test. For example, take this video of the user panning down in the contacts app:
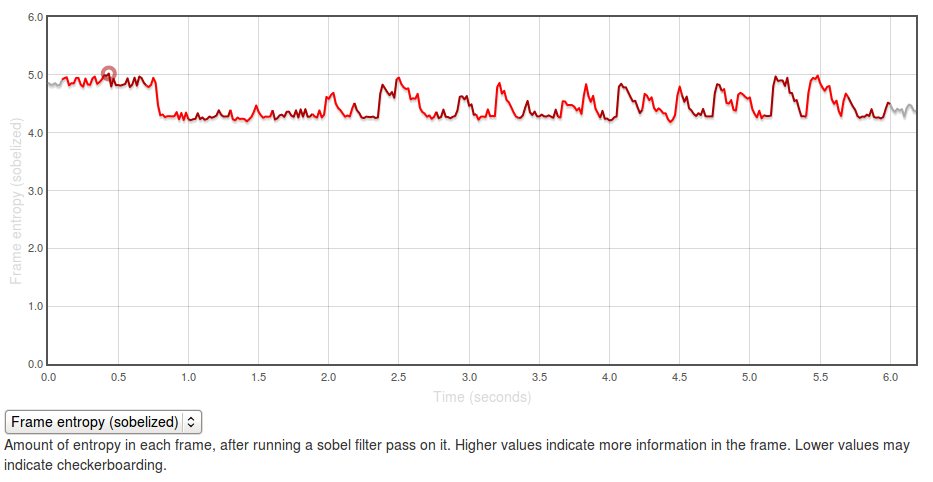
If you graph the entropies of the frame of the capture using the formula above you, you get a graph like this:

[Link to original]
The Y axis represents entropy, as calculated by the code above. There is no inherently “right” value for this — it all depends on the application you’re testing and what you expect to see displayed on the screen. In general though, higher values are better as it indicates more frames of the capture are “complete”.
The region at the beginning where it is at about 5.0 represents the contacts app with a set of contacts fully displayed (at startup). The “flat” regions where the entropy is at roughly 4.25? Those are the areas where the app is “checkerboarding” (blanking out waiting for graphics or layout engine to draw contact information). Click through to the original and swipe over the graph to see what I mean.
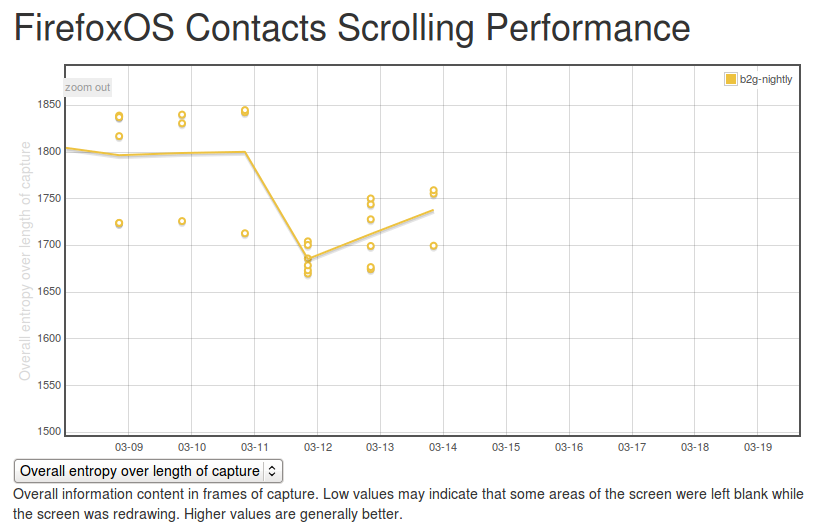
It’s easy to see what a hypothetical ideal end state would be for this capture: a graph with a smooth entropy of about 5.0 (similar to the start state, where all contacts are fully drawn in). We can track our progress towards this goal (or our deviation from it), by watching the eideticker b2g dashboard and seeing if the summation of the entropy values for frames over the entire test increases or decreases over time. If we see it generally increase, that probably means we’re seeing less checkerboarding in the capture. If we see it decrease, that might mean we’re now seeing checkerboarding where we weren’t before.
It’s too early to say for sure, but over the past few days the trend has been positive:

[Link to original]
(note that there were some problems in the way the tests were being run before, so results before the 12th should not be considered valid)
So one concept, at least two relevant metrics we can measure with it (startup time and checkerboarding). Are there any more? Almost certainly, let’s find them!
[ For more information on the Eideticker software I’m referring to, see this entry ]
Time for a long overdue eideticker-for-firefoxos update. Last time we were here (almost 5 months ago! man time flies), I was discussing methodologies for measuring startup performance. Since then, Dave Hunt and myself have been doing lots of work to make Eideticker more robust and useful. Notably, we now have a setup in London running a suite of Eideticker tests on the latest version of FirefoxOS on the Inari on a daily basis, reporting to http://eideticker.mozilla.org/b2g.

There were more than a few false starts with and some of the earlier data is not to be entirely trusted but it now seems to be chugging along nicely, hopefully providing startup numbers that provide a useful counterpoint to the datazilla startup numbers we’ve already been collecting for some time. There still seem to be some minor problems, but in general I am becoming more and more confident in it as time goes on.
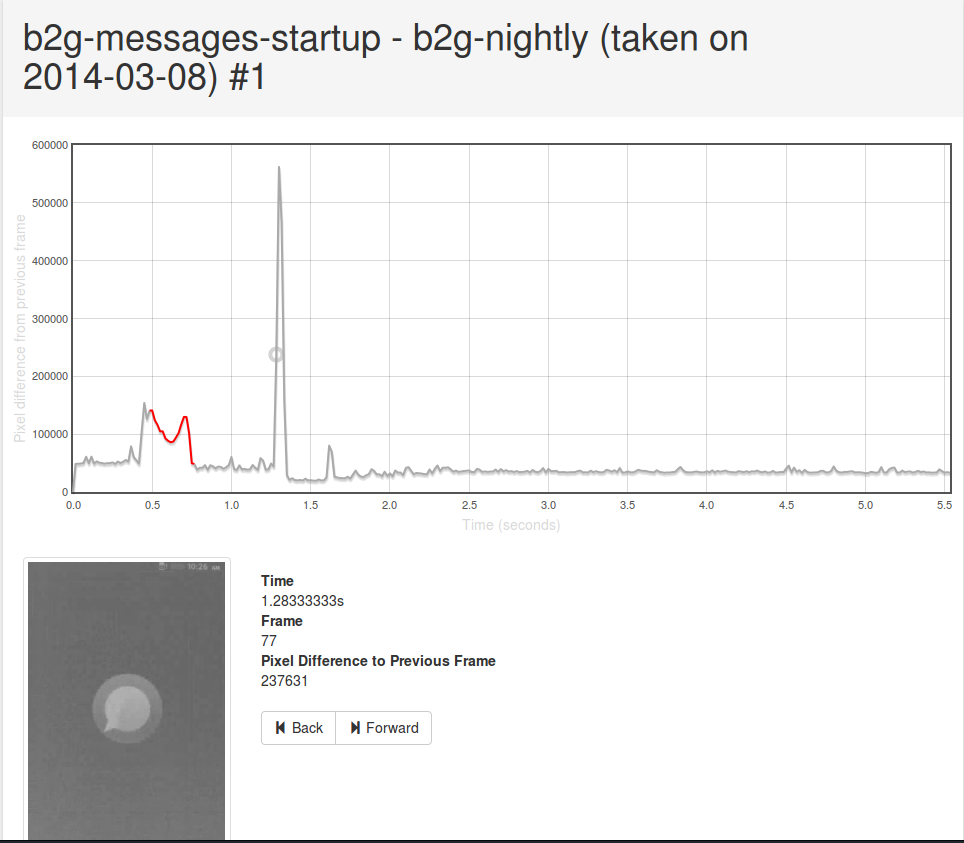
One feature that I am particularly proud of is the detail view, which enables you to see frame-by-frame what’s going on. Click on any datapoint on the graph, then open up the view that gives an account of what eideticker is measuring. Hover over the graph and you can see what the video looks like at any point in the capture. This not only lets you know that something regressed, but how. For example, in the messages app, you can scan through this view to see exactly when the first message shows up, and what exact state the application is in when Eideticker says it’s “done loading”.

[link to original]
(apologies for the low quality of the video — should be fixed with this bug next week)
As it turns out, this view has also proven to be particularly useful when working with the new entropy measurements in Eideticker which I’ve been using to measure checkerboarding (redraw delay) on FirefoxOS. More on that next week.
Just wanted to send out a quick note that I recently added inbound support to mozregression for desktop builds of Firefox on Windows, Mac, and Linux.
For the uninitiated, mozregression is an automated tool that lets you bisect through builds of Firefox to find out when a problem was introduced. You give it the last known good date, the last known bad date and off it will go, automatically pulling down builds to test. After each iteration, it will ask you whether this build was good or bad, update the regression range accordingly, and then the cycle repeats until there are no more intermediate builds.
Previously, it would only use nightlies which meant a one day granularity — this meant pretty wide regression ranges, made wider in the last year by the fact that so much more is now going into the tree over the course of the day. However, with inbound support (using the new inbound archive) we now have the potential to get a much tighter range, which should be super helpful for developers. Best of all, mozregression doesn’t require any particularly advanced skills to use which means everyone in the Mozilla community can help out.
For anyone interested, there’s quite a bit of scope to improve mozregression to make it do more things (FirefoxOS support, easier installation). Feel free to check out the repository, the issues list (I just added an easy one which would make a great first bug) and ask questions on irc.mozilla.org#ateam!
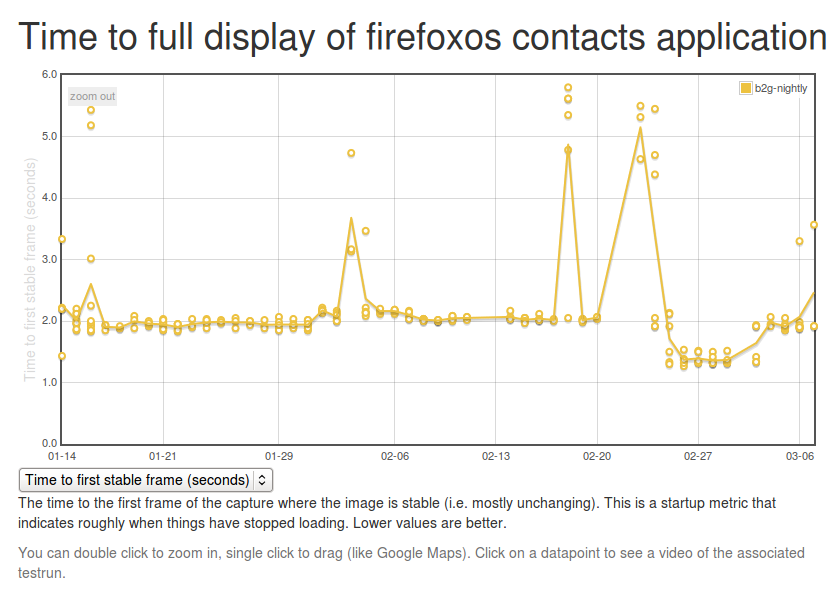
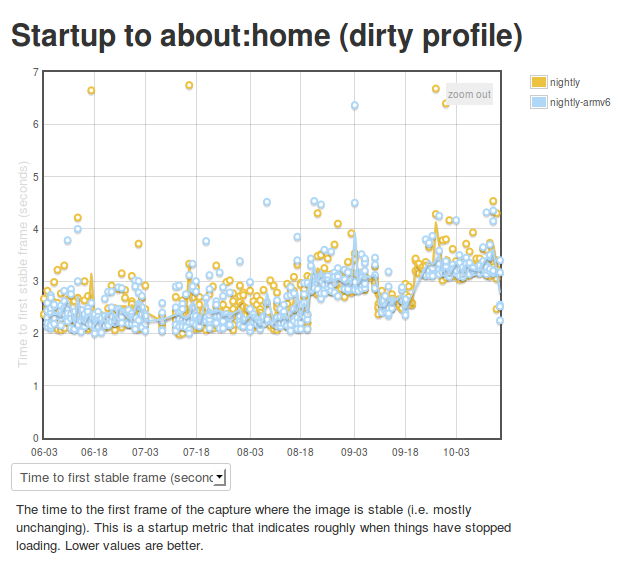
So we’ve been using Eideticker to automatically measure startup/pageload times for about a year now on Android, and more recently on FirefoxOS as well (albeit not automatically). This gives us nice and pretty graphs like this:

Ok, so we’re generating numbers and graphing them. That’s great. But what’s really going on behind the scenes? I’m glad you asked. The story is a bit different depending on which platform you’re talking about.
Android
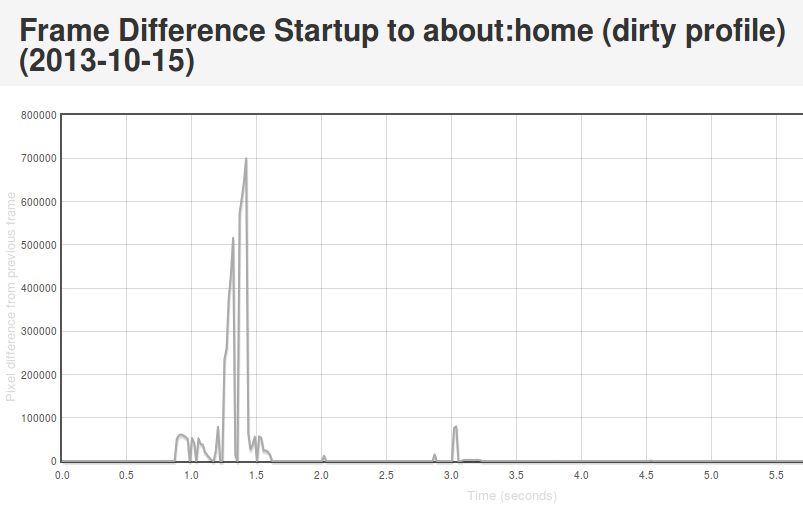
On Android we connect Eideticker to the device’s HDMI out, so we count on a nearly pixel-perfect signal. In practice, it isn’t quite, but it is within a few RGB values that we can easily filter for. This lets us come up with a pretty good mechanism for determining when a page load or app startup is finished: just compare frames, and say we’ve “stopped” when the pixel differences between frames are negligible (previously defined at 2048 pixels, now 4096 — see below). Eideticker’s new frame difference view lets us see how this works. Look at this graph of application startup:

[Link to original]
What’s going on here? Well, we see some huge jumps in the beginning. This represents the animated transitions that Android makes as we transition from the SUTAgent application (don’t ask) to the beginnings of the FirefoxOS browser chrome. You’ll notice though that there’s some more changes that come in around the 3 second mark. This is when the site bookmarks are fully loaded. If you load the original page (link above) and swipe your mouse over the graph, you can see what’s going on for yourself.
This approach is not completely without problems. It turns out that there is sometimes some minor churn in the display even when the app is for all intents and purposes started. For example, sometimes the scrollbar fading out of view can result in a significantish pixel value change, so I recently upped the threshold of pixels that are different from 2048 to 4096. We also recently encountered a silly problem with a random automation app displaying “toasts” which caused results to artificially spike. More tweaking may still be required. However, on the whole I’m pretty happy with this solution. It gives useful, undeniably objective results whose meaning is easy to understand.
FirefoxOS
So as mentioned previously, we use a camera on FirefoxOS to record output instead of HDMI output. Pretty unsurprisingly, this is much noisier. See this movie of the contacts app starting and note all the random lighting changes, for example:
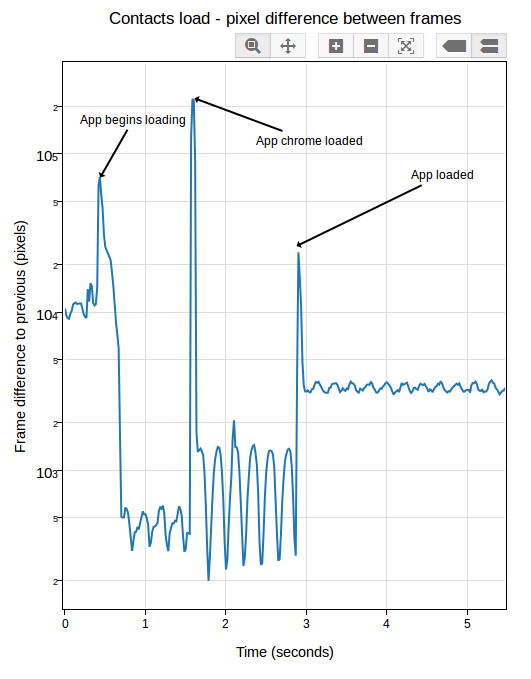
My experience has been that pixel differences can be so great between visually identical frames on an eideticker capture on these devices that it’s pretty much impossible to settle on when startup is done using the frame difference method. It’s of course possible to detect very large scale changes, but the small scale ones (like the contacts actually appearing in the example above) are very hard to distinguish from random differences in the amount of light absorbed by the camera sensor. Tricks like using median filtering (a.k.a. “blurring”) help a bit, but not much. Take a look at this graph, for example:
[Link to original]
You’ll note that the pixel differences during “static” parts of the capture are highly variable. This is because the pixel difference depends heavily on how “bright” each frame is: parts of the capture which are black (e.g. a contacts icon with a black background) have a much lower difference between them than parts that are bright (e.g. the contacts screen fully loaded).
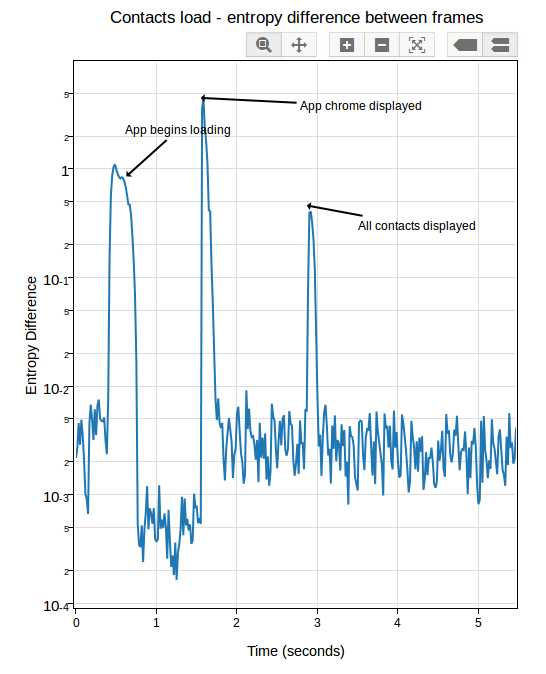
After a day or so of experimenting and research, I settled on an approach which seems to work pretty reliably. Instead of comparing the frames directly, I measure the entropy of the histogram of colours used in each frame (essentially just an indication of brightness in this case, see this article for more on calculating it), then compare that of each frame with the average of the same measure over 5 previous frames (to account for the fact that two frames may be arbitrarily different, but that is unlikely that a sequence of frames will be). This seems to work much better than frame difference in this environment: although there are plenty of minute differences in light absorption in a capture from this camera, the overall color composition stays mostly the same. See this graph:

[Link to original]
If you look closely, you can see some minor variance in the entropy differences depending on the state of the screen, but it’s not nearly as pronounced as before. In practice, I’ve been able to get extremely consistent numbers with a reasonable “threshold” of “0.05”.
In Eideticker I’ve tried to steer away from using really complicated math or algorithms to measure things, unless all the alternatives fail. In that sense, I really liked the simplicity of “pixel differences” and am not thrilled about having to resort to this: hopefully the concepts in this case (histograms and entropy) are simple enough that most people will be able to understand my methodology, if they care to. Likely I will need to come up with something else for measuring responsiveness and animation smoothness (frames per second), as likely we can’t count on light composition changing the same way for those cases. My initial thought was to use edge detection (which, while somewhat complex to calculate, is at least easy to understand conceptually) but am open to other ideas.
[ For more information on the Eideticker software I’m referring to, see this entry ]
Time for another update on Eideticker. In the last quarter, I’ve been working on two main items:
- Responsiveness tests (Android / FirefoxOS)
- Eideticker for FirefoxOS
The focus of this post is the responsiveness work. I’ll talk about Eideticker for FirefoxOS soon.
So what do I mean by responsiveness? At a high-level, I mean how quickly one sees a response after performing an action on the device. For example, if I perform a swipe gesture to scroll the content down while browsing CNN.com, how long does it take after
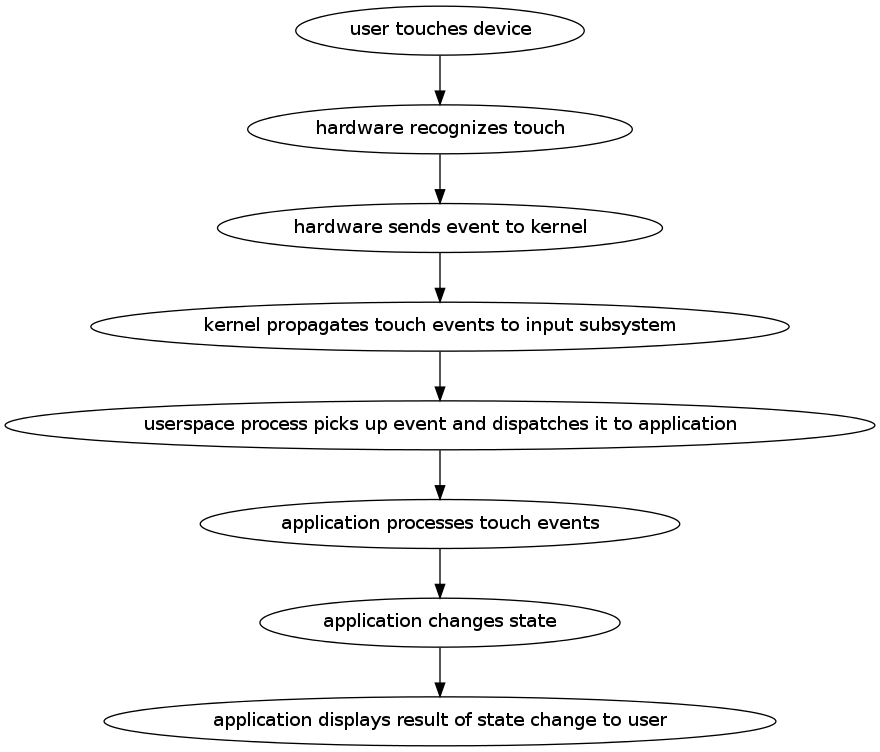
I start the gesture for the content to visibly scroll down? If you break it down, there’s a multi-step process that happens behind the scenes after a user action like this:

If anywhere in the steps above, there is a significant delay, the user experience is likely to be bad. Usability research
suggests that any lag that is consistently above 100 milliseconds will lead the user to perceive things as being laggy. To keep our users happy, we need to do our bit to make sure that we respond quickly at all levels that we control (just the application layer on Android, but pretty much everything on FirefoxOS). Even if we can’t complete the work required on our end to completely respond to the user’s desire, we should at least display something to acknowledge that things have changed.
But you can’t improve what you can’t measure. Fortunately, we have the means to do calculate of the time delta between most of the steps above. I learned from Taras Glek this weekend that it should be possible to simulate the actual capacitative touch event on a modern touch screen. We can recognize when the hardware event is available to be consumed by userspace by monitoring the `/dev/input` subsystem. And once the event reaches the application (the Android or FirefoxOS application) there’s no reason we can’t add instrumentation in all sorts of places to track the processing of both the event and the rendering of the response.
My working hypothesis is that it’s application-level latency (i.e. the time between the application receiving the event and being able to act on it) that dominates, so that’s what I decided to measure. This is purely based on intuition and by no means proven, so we should test this (it would certainly be an interesting exercise!). However, even if it turns out that there are significant problems here, we still care about the other bits of the stack — there’s lots of potentially-latency-introducing churn there and the risk of regression in our own code is probably higher than it is elsewhere since it changes so much.
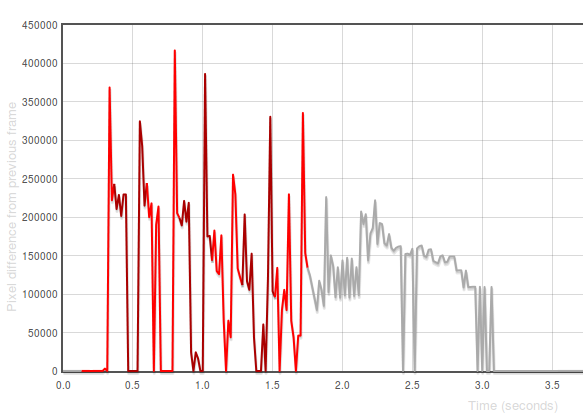
Last year, I wrote up a tool called Orangutan that can directly inject input events into an input device on Android or FirefoxOS. It seemed like a fairly straightforward extension of the tool to output timestamps when these events were registered. It was. Then, by synchronizing the time between the device and the machine doing the capturing, we can then correlate the input timestamps to events. To help visualize what’s going on, I generated this view:

[Link to original]
The X axis in that graph represents time. The Y-axis represents the difference between the frame at that time with the previous one in number of pixels. The “red” represents periods in capture when events are ongoing (we use different colours only to
distinguish distinct events). 1
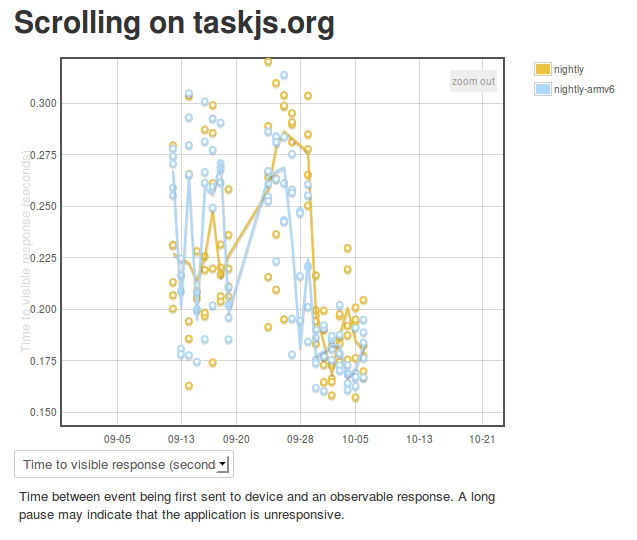
For a first pass at measuring responsiveness, I decided to measure the time between the first event being initiated and there being a significant frame difference (i.e. an observable response to the action). You can see some preliminary results on the eideticker dashboard:

[Link to original]
The results seem pretty highly variable at first because I was synchronizing time between the device and an external ntp server, rather than the host machine. I believe this is now fixed, hopefully giving us results that will indicate when regressions occur. As time goes by, we may want to craft some special eideticker tests for responsiveness specifically (e.g. a site where there is heavy javascript background processing).
1 Incidentally, these “frame difference” graphs are also quite useful for understanding where and how application startup has regressed in Fennec — try opening these two startup views side-by-side (before/after a large regression) and spot the difference: [1] and [2])
Today I did a quick port of Larry Doolittle’s ntpclient program to Android and FirefoxOS. Basically this lets you easily synchronize your device’s time to that of a central server. Yes, there’s lots and lots of Android “applications” which let you do this, but I wanted to be able to do this from the command line because that’s how I roll. If you’re interested, source and instructions are here:
https://github.com/wlach/ntpclient-android
For those curious, no, I didn’t just do this for fun. For next quarter, we want to write some Eideticker-based responsiveness tests for FirefoxOS and Android. For example, how long does it take from the time you tap on an icon in the homescreen on FirefoxOS to when the application is fully loaded? Or on Android, how long does it take to see a full list of sites in the awesomebar from the time you tap on the URL field and enter your search term?
Because an Eideticker test run involves two different machines (a host machine which controls the device and captures video of it in action, as well as the device itself), we need to use timestamps to really understand when and how events are being sent to the device. To do that reliably, we really need some easy way of synchronizing time between two machines (or at least accounting for the difference in their clocks, which amounts to about the same thing). NTP struck me as being the easiest, most standard way of doing this.
[ For more information on the Eideticker software I’m referring to, see this entry ]
I just put up a proof of concept Eideticker dashboard for FirefoxOS here. Right now it has two days worth of data, manually sampled from an Unagi device running b2g18. Right now there are two tests: one the measures the “speed” of the contacts application scrolling, another that measures the amount of time it takes for the contacts application to be fully loaded.
For those not already familiar with it, Eideticker is a benchmarking suite which captures live video data coming from a device and analyzes it to determine performance. This lets us get data which is more representative of actual user experience (as opposed to an oft artificial benchmark). For example, Eideticker measures contacts startup as taking anywhere between 3.5 seconds and 4.5 seconds, versus than the 0.5 to 1 seconds that the existing datazilla benchmarks show. What accounts for the difference? If you step through an eideticker-captured video, you can see that even though something appears very quickly, not all the contacts are displayed until the 3.5 second mark. There is a gap between an app being reported as “loaded” and it being fully available for use, which we had not been measuring until now.
At this point, I am most interested in hearing from FirefoxOS developers on new tests that would be interesting and useful to track performance of the system on an ongoing basis. I’d obviously prefer to focus on things which have been difficult to measure accurately through other means. My setup is rather fiddly right now, but hopefully soon we can get some useful numbers going on an ongoing basis, as we do already for Firefox for Android.
Another update on getting Eideticker working with FirefoxOS. Once again this is sort of high-level, looking forward to writing something more in-depth soon now that we have the basics working.
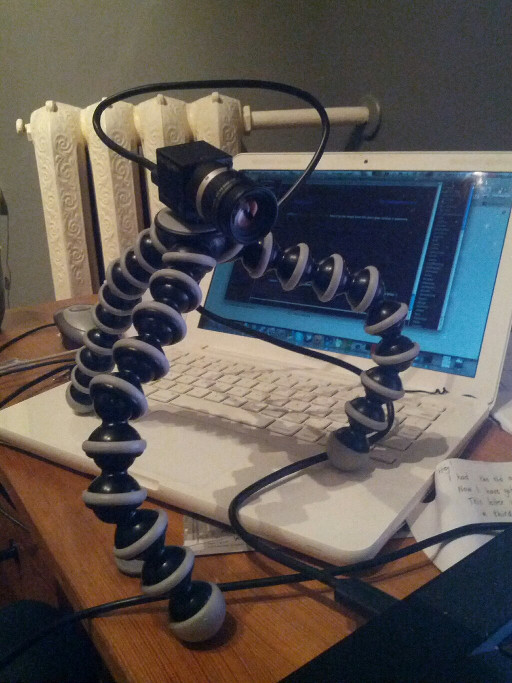
I finally got the last kinks out of the rig I was using to capture live video from FirefoxOS phones using the Point Grey devices last week. In order to make things reasonable I had to write some custom code to isolate the actual device screen from the rest of capture and a few other things. The setup looks interesting (reminds me a bit of something out of the War of the Worlds):

Here’s some example video of a test I wrote up to measure the performance of contacts scrolling performance (measured at a very respectable 44 frames per second, in case you wondering):
Surprisingly enough, I didn’t wind up having to write up any code to compensate for a noisy image. Of course there’s a certain amount of variance in every frame depending on how much light is hitting the camera sensor at any particular moment, but apparently not enough to interfere with getting useful results in the tests I’ve been running.
Likely next step: Create some kind of chassis for mounting both the camera and device on a permanent basis (instead of an adhoc one on my desk) so we can start running these sorts of tests on a daily basis, much like we currently do with Android on the Eideticker Dashboard.
As an aside, I’ve been really impressed with both the Marionette framework and the gaiatests python module that was written up for FirefoxOS. Writing the above test took just 5 minutes — and the code is quite straightforward. Quite the pleasant change from my various efforts in Android automation.
Last summer I wrote a bit about using Eideticker to measure the relative performance of Firefox for Android versus other browsers (Chrome, stock, etc.). At the time I was pretty optimistic about Eideticker’s usefulness as a truly “objective” measure of user experience that would give us a more accurate view of how we compared against the competition than traditional benchmarking suites (which more often than not, measure things that a user will never see normally when browsing the web). Since then, there’s been some things that I’ve discovered, as well as some developments in terms of the “state of the art” in mobile browsing that have caused me to reconsider that view — while I haven’t given up entirely on this concept (and I’m still very much convinced of eideticker’s utility as an internal benchmarking tool), there’s definitely some limitations in terms of what we can do that I’m not sure how to overcome.
Essentially, there are currently three different types of Eideticker performance tests:
- Animation tests: Measure the smoothness of an animation by comparing frames and seeing how many are different. Currently the only example of this is the canvas “clock” test, but many others are possible.
- Startup tests: Measure the amount of time it takes from when the application is launched to when the browser is fully running/available. There are currently two variants of this test in the dashboard, both measure the amount of time taken to fully render Firefox’s home screen (the only difference between the two is whether the browser profile is fully initialized). The dirty profile benchmark probably most closely resembles what a user would usually experience.
- Scrolling tests: Measure the amount of undrawn areas when the user is panning a website. Most of the current eideticker tests are of this kind. A good example of this is the taskjs benchmark.
In this blog post, I’m going to focus on startup and scrolling tests. Animation tests are interesting, but they are also generally the sorts of tests that are easiest to measure in synthetic ways (e.g. by putting a frame counter in your javascript code) and have thus far not been a huge focus for Eideticker development.
As it turns out, it’s unfortunately been rather difficult to create truly objective tests which measure the difference between browsers in these two categories. I’ll go over them in order.
Startup tests
There are essentially two types of startup tests: one where you measure the amount of time to get to the browser’s home screen when you explicitly launch the app (e.g. by pressing the Firefox icon in the app chooser), another where you load a web page in a browser from another app (e.g. by clicking on a link in the Twitter application).
The first is actually fairly easy to test across browsers, although we are not currently. There’s not really a good reason for that, it was just an oversight, so I filed bug 852744 to add something like this.
The second case (startup to the browser’s homescreen) is a bit more difficult. The problem here is that, in a nutshell, an apples to apples comparison is very difficult if not impossible simply because different browsers do different things when the user presses the application icon. Here’s what we see with Firefox:

And here’s what we see with Chrome:

And here’s what we see with the stock browser:

As you can see Chrome and the stock browser are totally different: they try to “restore” the browser back to its state from the last time (in Chrome’s case, I was last visiting taskjs.org, in Stock’s case, I was just on the homepage).
Personally I prefer Firefox’s behaviour (generally I want to browse somewhere new when I press the icon on my phone), but that’s really beside the point. It’s possible to hack around what chrome is doing by restoring the profile between sessions to some sort of clean “new tab” state, but at that point you’re not really reproducing a realistic user scenario. Sure, we can draw a comparison, but how valid is it really? It seems to me that the comparison is mostly only useful in a very broad “how quickly does the user see something useful” sense.
Panning tests
I had quite a bit of hope for these initially. They seemed like a place where Eideticker could do something that conventional benchmarking suites couldn’t, as things like panning a web page are not presently possible to do in JavaScript. The main measure I tried to compare against was something called “checkerboarding”, which essentially represents the amount of time that the user waits for the page to redraw when panning around.
At the time that I wrote these tests, most browsers displayed regions that were not yet drawn while panning using the page background. We figured that it would thus be possible to detect regions of the page which were not yet drawn by looking for the background color while initiating a panning action. I thus hacked up existing web pages to have a magenta background, then wrote some image analysis code to detect regions that were that color (under the assumption that magenta is only rarely seen in webpages). It worked pretty well.
The world’s moved on a bit since I wrote that: modern browsers like Chrome and Firefox use something like progressive drawing to display a lower resolution “tile” where possible in this case, so the user at least sees something resembling the actual page while panning on a slower device. To see what I mean, try visiting a slow-to-render site like taskjs.org and try panning down quickly. You should see something like this (click to expand):

Unfortunately, while this is certainly a better user experience, it is not so easy to detect and measure. For Firefox, we’ve disabled this behaviour so that we see the old checkerboard pattern. This is useful for our internal measurements (we can see both if our drawing code as well as our heuristics about when to draw are getting better or worse over time) but it only works for us.
If anyone has any suggestions on what to do here, let me know as I’m a bit stuck. There are other metrics we could still compare against (i.e. how smooth is the panning animation aka frames per second?) but these aren’t nearly as interesting.
