[ For more information on the Eideticker software I’m referring to, see this entry ]
Time for a long overdue eideticker-for-firefoxos update. Last time we were here (almost 5 months ago! man time flies), I was discussing methodologies for measuring startup performance. Since then, Dave Hunt and myself have been doing lots of work to make Eideticker more robust and useful. Notably, we now have a setup in London running a suite of Eideticker tests on the latest version of FirefoxOS on the Inari on a daily basis, reporting to http://eideticker.mozilla.org/b2g.
There were more than a few false starts with and some of the earlier data is not to be entirely trusted but it now seems to be chugging along nicely, hopefully providing startup numbers that provide a useful counterpoint to the datazilla startup numbers we’ve already been collecting for some time. There still seem to be some minor problems, but in general I am becoming more and more confident in it as time goes on.
One feature that I am particularly proud of is the detail view, which enables you to see frame-by-frame what’s going on. Click on any datapoint on the graph, then open up the view that gives an account of what eideticker is measuring. Hover over the graph and you can see what the video looks like at any point in the capture. This not only lets you know that something regressed, but how. For example, in the messages app, you can scan through this view to see exactly when the first message shows up, and what exact state the application is in when Eideticker says it’s “done loading”.
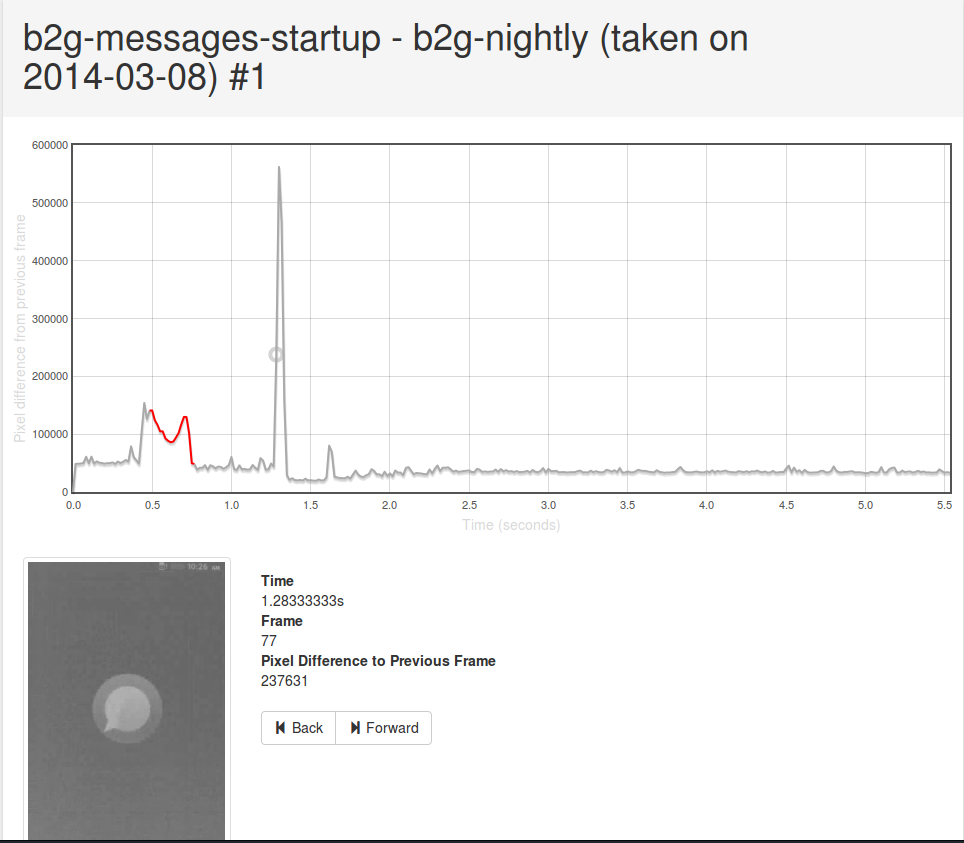
[link to original]
(apologies for the low quality of the video — should be fixed with this bug next week)
As it turns out, this view has also proven to be particularly useful when working with the new entropy measurements in Eideticker which I’ve been using to measure checkerboarding (redraw delay) on FirefoxOS. More on that next week.
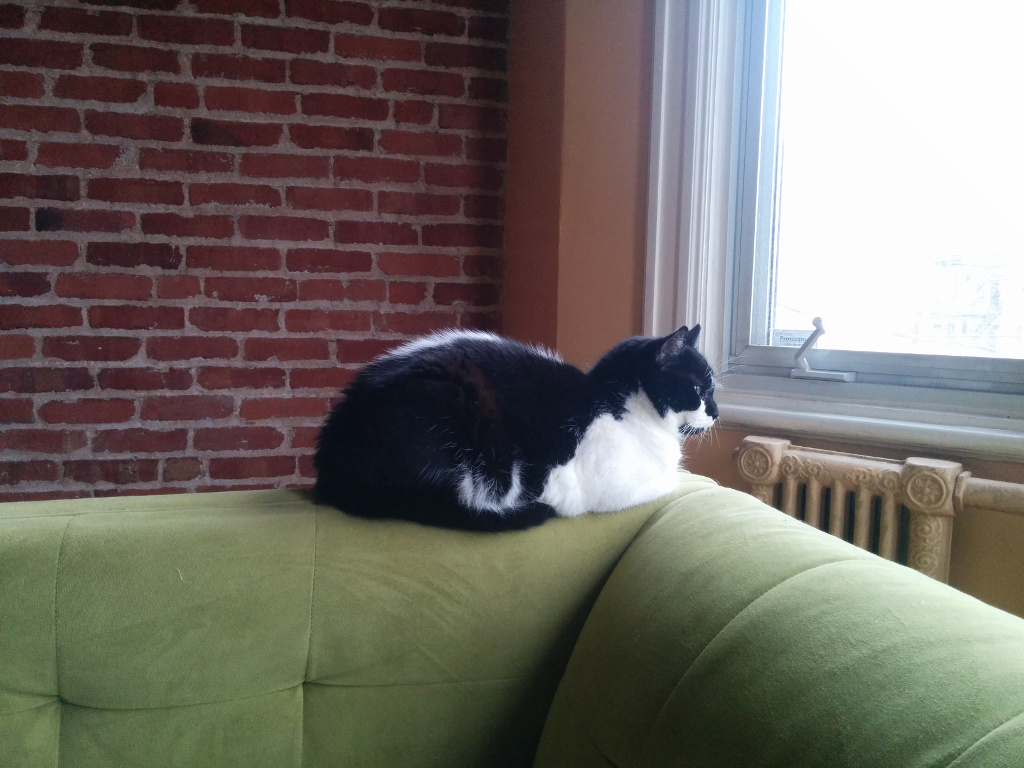
He sits on the edge of my couch, stoic. At rest, yet alert for anything to happen at any moment. Whether that be a mouse running across the room (fat chance here) or me getting up to go into the kitchen. I took this picture just after zazen (meditating) — I struggle and struggle and yet right beside me sits a creature that constantly practices in the highest form (shikantaza, “just sitting”) without even trying. An example for me to follow?
Just wanted to send out a quick note that I recently added inbound support to mozregression for desktop builds of Firefox on Windows, Mac, and Linux.
For the uninitiated, mozregression is an automated tool that lets you bisect through builds of Firefox to find out when a problem was introduced. You give it the last known good date, the last known bad date and off it will go, automatically pulling down builds to test. After each iteration, it will ask you whether this build was good or bad, update the regression range accordingly, and then the cycle repeats until there are no more intermediate builds.
Previously, it would only use nightlies which meant a one day granularity — this meant pretty wide regression ranges, made wider in the last year by the fact that so much more is now going into the tree over the course of the day. However, with inbound support (using the new inbound archive) we now have the potential to get a much tighter range, which should be super helpful for developers. Best of all, mozregression doesn’t require any particularly advanced skills to use which means everyone in the Mozilla community can help out.
For anyone interested, there’s quite a bit of scope to improve mozregression to make it do more things (FirefoxOS support, easier installation). Feel free to check out the repository, the issues list (I just added an easy one which would make a great first bug) and ask questions on irc.mozilla.org#ateam!
A few months ago, I started blogging a bit about my fledgling Buddhist meditation practice, and then abruptly stopped. I thought I’d write just a few words about why I didn’t continue.
Over time, one of the things that I found most difficult about my practice was keeping it relatively pure. The whole point is to just sit and follow the breath with no extra motivation or hidden agenda. Given that, having it in the back of my mind to later try to explain my practice to a broad audience was at best a distraction. At worst, I worried that it might actually be hindering my progress.
After some thinking about it where my desire to explain this stuff came from, I determined that there was a root desire there to make the world conform to my expectations of what it *should* be. Which, if you stop and think about it, is just another form of greed. We often think of our desires as being about personal gratification (food, sex, cars, whatever) but that’s really too narrow a view — we’re social creatures, and our desires and aversions inevitably extend to the social sphere as well.
I suppose that sounds rather judgemental or moralistic, but it’s really not intended that way. This is just the nature of human experience, and I am certainly not exempt from that. There is probably at least some element of this greed at the root of much of my writing, whether it be discussing my latest computational vision problem at work or how I think coffee should be brewed — but at least in those cases articulating myself doesn’t interfere with the activity itself.
A frequent misunderstanding of the practice of Buddhism is that it’s about eliminating desire. As I understand it, it’s not so much that, as it is about putting desires in proper perspective. To not be ruled by them. If I have a social purpose in the back of my head during the practice, well, that’s going to be a problem. It’ll be constantly in the background, subtly influencing what I process and how I process it (e.g. the thought “how am I going to describe that”). I have enough issues meditating without adding to them.
Moreover, one of the things I’ve realized over the last few months is that the way people process the world around the world is pretty differently. I’m lucky enough to have a mind able to sit still for (average) 20 minutes a day. Not perfectly of course — many times I feel like I’m caught up with a million random thoughts for 90% of a session, but as I understand it that’s just part of the process. At least I can sit still! I’ve since learned that this isn’t easy at all for other people (the urge to get up and do something else is overwhelming) and I really have no insight at present into what would make it easier for them (they had tried most of what I suggested to no avail). So I am a bit concerned that what I have to say would act more as a hindrance to the journey of others rather than a help.
All this is not to say that I’m not happy to discuss my experiences one on one with anyone who’s interested. If you’re curious, by all means feel free to contact me — though I suspect you’d probably do better reaching out to a dedicated teacher who has more experience in these matters than I. If you can’t find one, I would again recommend Mindfulness in Plain English.
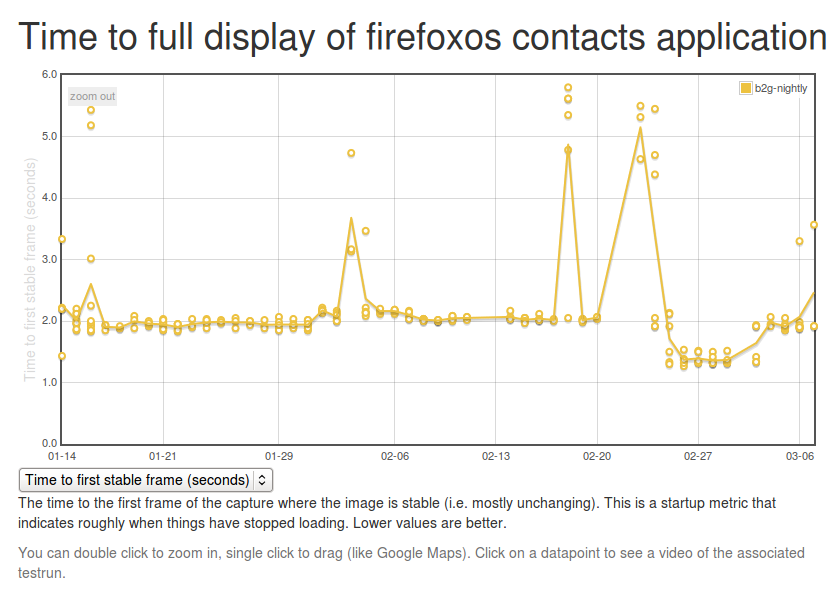
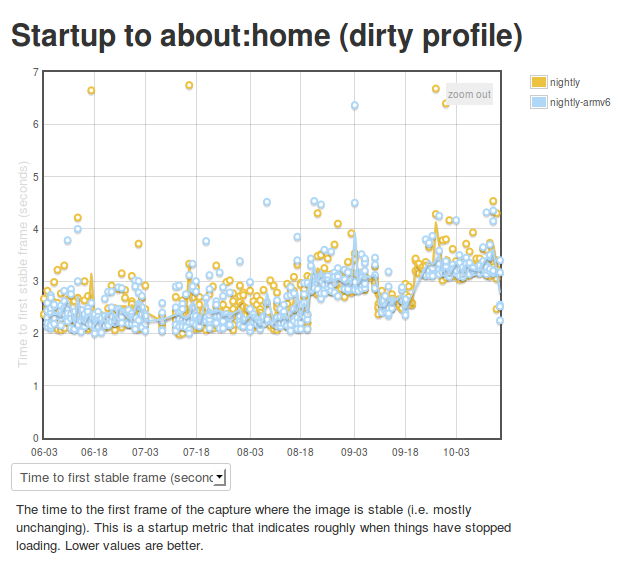
So we’ve been using Eideticker to automatically measure startup/pageload times for about a year now on Android, and more recently on FirefoxOS as well (albeit not automatically). This gives us nice and pretty graphs like this:
Ok, so we’re generating numbers and graphing them. That’s great. But what’s really going on behind the scenes? I’m glad you asked. The story is a bit different depending on which platform you’re talking about.
Android
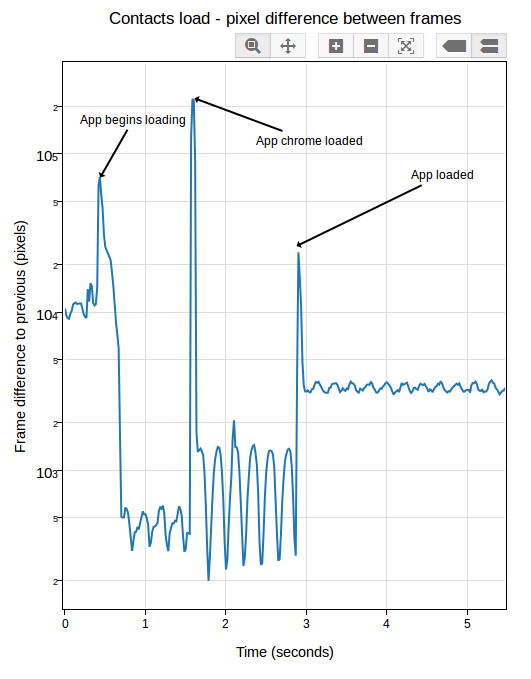
On Android we connect Eideticker to the device’s HDMI out, so we count on a nearly pixel-perfect signal. In practice, it isn’t quite, but it is within a few RGB values that we can easily filter for. This lets us come up with a pretty good mechanism for determining when a page load or app startup is finished: just compare frames, and say we’ve “stopped” when the pixel differences between frames are negligible (previously defined at 2048 pixels, now 4096 — see below). Eideticker’s new frame difference view lets us see how this works. Look at this graph of application startup:
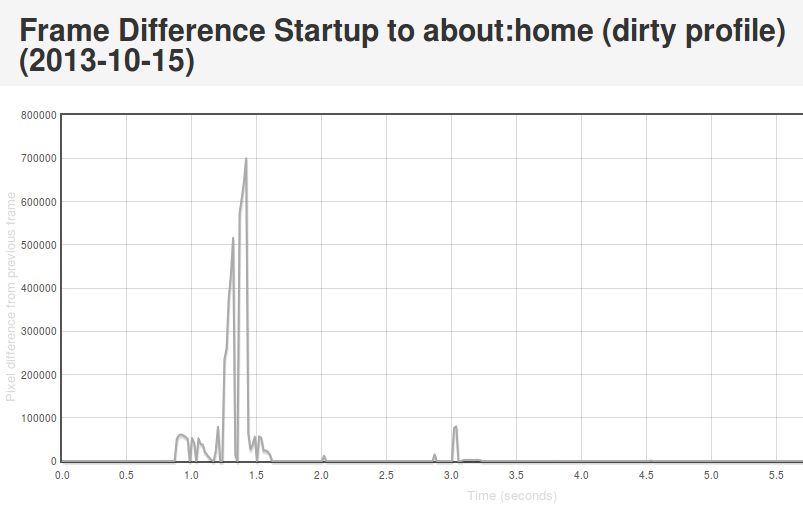
[Link to original]
What’s going on here? Well, we see some huge jumps in the beginning. This represents the animated transitions that Android makes as we transition from the SUTAgent application (don’t ask) to the beginnings of the FirefoxOS browser chrome. You’ll notice though that there’s some more changes that come in around the 3 second mark. This is when the site bookmarks are fully loaded. If you load the original page (link above) and swipe your mouse over the graph, you can see what’s going on for yourself.
This approach is not completely without problems. It turns out that there is sometimes some minor churn in the display even when the app is for all intents and purposes started. For example, sometimes the scrollbar fading out of view can result in a significantish pixel value change, so I recently upped the threshold of pixels that are different from 2048 to 4096. We also recently encountered a silly problem with a random automation app displaying “toasts” which caused results to artificially spike. More tweaking may still be required. However, on the whole I’m pretty happy with this solution. It gives useful, undeniably objective results whose meaning is easy to understand.
FirefoxOS
So as mentioned previously, we use a camera on FirefoxOS to record output instead of HDMI output. Pretty unsurprisingly, this is much noisier. See this movie of the contacts app starting and note all the random lighting changes, for example:
My experience has been that pixel differences can be so great between visually identical frames on an eideticker capture on these devices that it’s pretty much impossible to settle on when startup is done using the frame difference method. It’s of course possible to detect very large scale changes, but the small scale ones (like the contacts actually appearing in the example above) are very hard to distinguish from random differences in the amount of light absorbed by the camera sensor. Tricks like using median filtering (a.k.a. “blurring”) help a bit, but not much. Take a look at this graph, for example:
[Link to original]
You’ll note that the pixel differences during “static” parts of the capture are highly variable. This is because the pixel difference depends heavily on how “bright” each frame is: parts of the capture which are black (e.g. a contacts icon with a black background) have a much lower difference between them than parts that are bright (e.g. the contacts screen fully loaded).
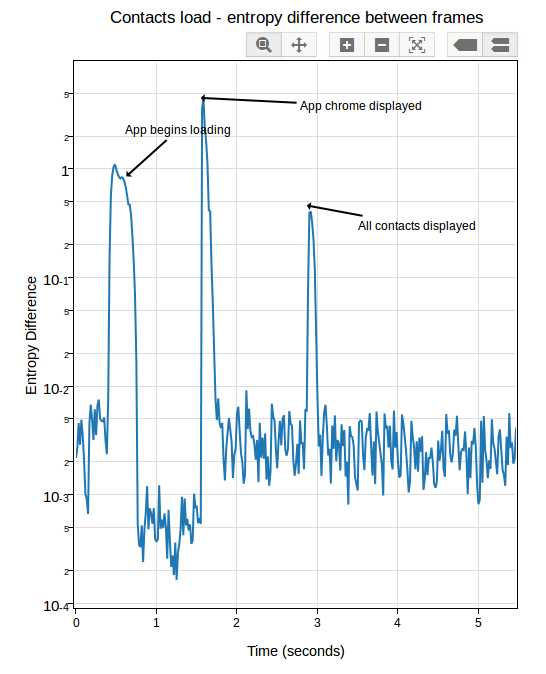
After a day or so of experimenting and research, I settled on an approach which seems to work pretty reliably. Instead of comparing the frames directly, I measure the entropy of the histogram of colours used in each frame (essentially just an indication of brightness in this case, see this article for more on calculating it), then compare that of each frame with the average of the same measure over 5 previous frames (to account for the fact that two frames may be arbitrarily different, but that is unlikely that a sequence of frames will be). This seems to work much better than frame difference in this environment: although there are plenty of minute differences in light absorption in a capture from this camera, the overall color composition stays mostly the same. See this graph:
[Link to original]
If you look closely, you can see some minor variance in the entropy differences depending on the state of the screen, but it’s not nearly as pronounced as before. In practice, I’ve been able to get extremely consistent numbers with a reasonable “threshold” of “0.05”.
In Eideticker I’ve tried to steer away from using really complicated math or algorithms to measure things, unless all the alternatives fail. In that sense, I really liked the simplicity of “pixel differences” and am not thrilled about having to resort to this: hopefully the concepts in this case (histograms and entropy) are simple enough that most people will be able to understand my methodology, if they care to. Likely I will need to come up with something else for measuring responsiveness and animation smoothness (frames per second), as likely we can’t count on light composition changing the same way for those cases. My initial thought was to use edge detection (which, while somewhat complex to calculate, is at least easy to understand conceptually) but am open to other ideas.
[ For more information on the Eideticker software I’m referring to, see this entry ]
Time for another update on Eideticker. In the last quarter, I’ve been working on two main items:
- Responsiveness tests (Android / FirefoxOS)
- Eideticker for FirefoxOS
The focus of this post is the responsiveness work. I’ll talk about Eideticker for FirefoxOS soon.
So what do I mean by responsiveness? At a high-level, I mean how quickly one sees a response after performing an action on the device. For example, if I perform a swipe gesture to scroll the content down while browsing CNN.com, how long does it take after
I start the gesture for the content to visibly scroll down? If you break it down, there’s a multi-step process that happens behind the scenes after a user action like this:
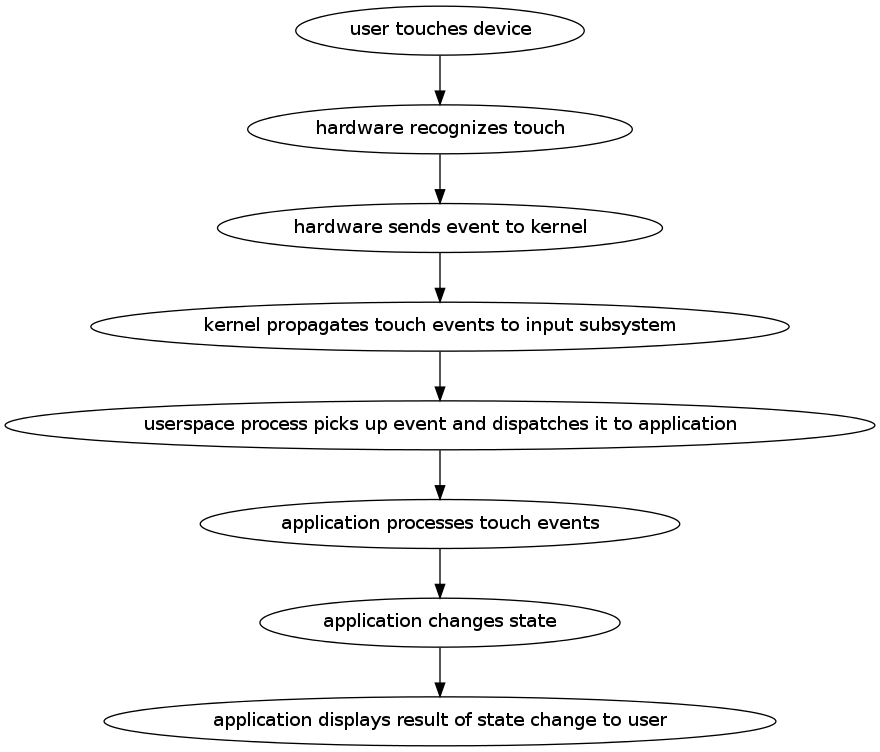
If anywhere in the steps above, there is a significant delay, the user experience is likely to be bad. Usability research
suggests that any lag that is consistently above 100 milliseconds will lead the user to perceive things as being laggy. To keep our users happy, we need to do our bit to make sure that we respond quickly at all levels that we control (just the application layer on Android, but pretty much everything on FirefoxOS). Even if we can’t complete the work required on our end to completely respond to the user’s desire, we should at least display something to acknowledge that things have changed.
But you can’t improve what you can’t measure. Fortunately, we have the means to do calculate of the time delta between most of the steps above. I learned from Taras Glek this weekend that it should be possible to simulate the actual capacitative touch event on a modern touch screen. We can recognize when the hardware event is available to be consumed by userspace by monitoring the `/dev/input` subsystem. And once the event reaches the application (the Android or FirefoxOS application) there’s no reason we can’t add instrumentation in all sorts of places to track the processing of both the event and the rendering of the response.
My working hypothesis is that it’s application-level latency (i.e. the time between the application receiving the event and being able to act on it) that dominates, so that’s what I decided to measure. This is purely based on intuition and by no means proven, so we should test this (it would certainly be an interesting exercise!). However, even if it turns out that there are significant problems here, we still care about the other bits of the stack — there’s lots of potentially-latency-introducing churn there and the risk of regression in our own code is probably higher than it is elsewhere since it changes so much.
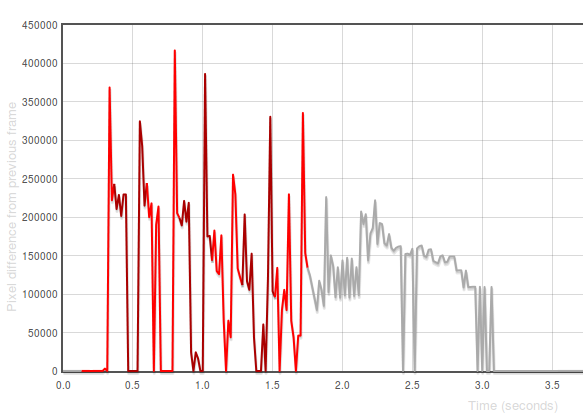
Last year, I wrote up a tool called Orangutan that can directly inject input events into an input device on Android or FirefoxOS. It seemed like a fairly straightforward extension of the tool to output timestamps when these events were registered. It was. Then, by synchronizing the time between the device and the machine doing the capturing, we can then correlate the input timestamps to events. To help visualize what’s going on, I generated this view:
[Link to original]
The X axis in that graph represents time. The Y-axis represents the difference between the frame at that time with the previous one in number of pixels. The “red” represents periods in capture when events are ongoing (we use different colours only to
distinguish distinct events). 1
For a first pass at measuring responsiveness, I decided to measure the time between the first event being initiated and there being a significant frame difference (i.e. an observable response to the action). You can see some preliminary results on the eideticker dashboard:
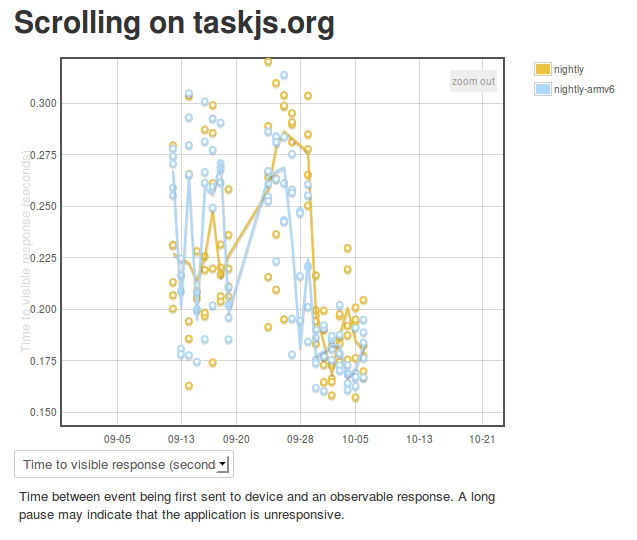
[Link to original]
The results seem pretty highly variable at first because I was synchronizing time between the device and an external ntp server, rather than the host machine. I believe this is now fixed, hopefully giving us results that will indicate when regressions occur. As time goes by, we may want to craft some special eideticker tests for responsiveness specifically (e.g. a site where there is heavy javascript background processing).
1 Incidentally, these “frame difference” graphs are also quite useful for understanding where and how application startup has regressed in Fennec — try opening these two startup views side-by-side (before/after a large regression) and spot the difference: [1] and [2])
Last night while I was lying in bed the mystery of my being here, present, again occurred to me. Pondered that a bit upon waking up. Let me formulate two mysteries that, as far as I know, no one has given really satisfactory answers to:
- Why does anything exist at all? And given that things do exist, why should they take the form that they do (planets, suns, nebulae, even life)?
- What accounts for the “subjectivity” of experience? That is, why is life not only here, but (in humanity’s case at least, probably in the case of other higher-order life, and possibly all life) there is a *conscious* experience that goes on with our perceptions of the world? It does not seem necessary for (1), does it?
Perhaps the answer here is just that the way our minds (and hence anything we could form into thought or language) is based on descriptions of the world according to our perception. But (1) and (2) are in a sense, beyond this. I think in the case of (1) it is obvious why. In the case of (2) this might just be a limitation of our language/thought — certainly we can express that someone/something is conscious in a 3rd party sort of way (i.e. “she perceived red”), though this does not (as far as I can tell) express the realness of the experience. It’s a description, not the experience. To really understand experience from a 3rd person perspective (and hence why it exists?), you would need to go outside experience — but description is part of experience! The concept of being outside of it makes no sense.
[ Maybe I am just restating Kant here ]
I was kind of appalled today to see this:
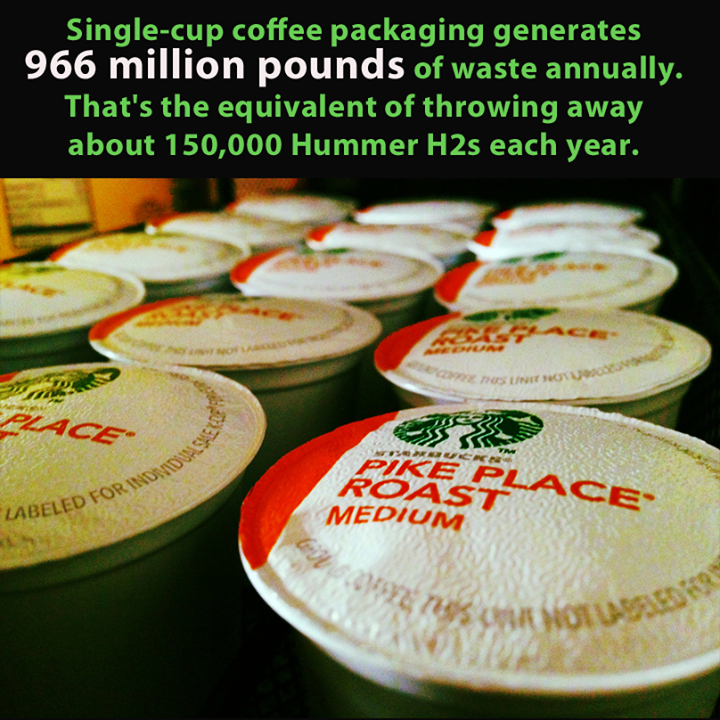
I initially thought this had to be a tall tale told by hippies, but doing a back of the envelope calculation, I realized that such a figure is entirely possible. Assume each packet weighs 0.05 pounds. Typing that into python I get:
<br />

> > > 966\*(10\*\*6)/0.05<br />
> > > 19320000000.0
19 billion packets. Seems awfully big. But divide that by, say, 10 million people:
>>> x = 966\*(10\*\*6)/0.05<br />

> > > x/10\*\*7<br />
> > > 1932.0
1932 cups. Hmm, still seems big. That’s more than 5 cups a day. But if we say 30 million people are drinking this stuff, we rapidly get to the zone of plausibility.
People, it doesn’t have to be this way. You can have way better coffee that produces zero waste for only marginally more effort. Allow me to present the Will method of coffee production. First off, you use this thing:

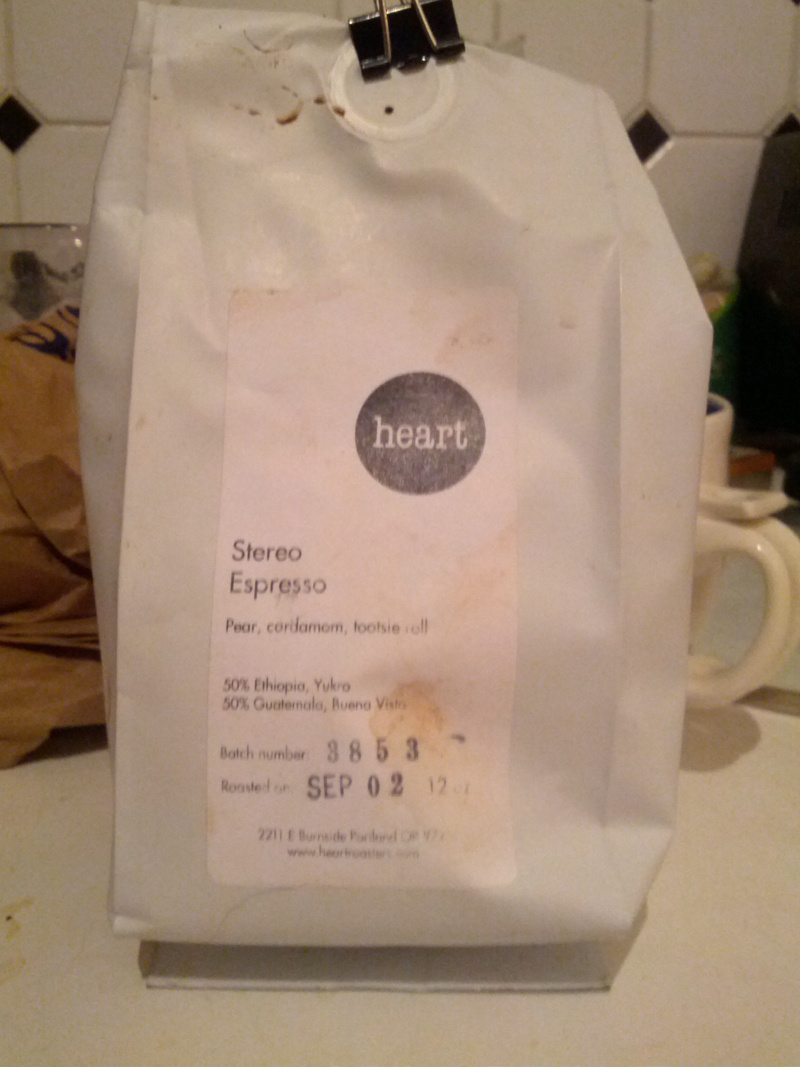
I have tried alternatives: french presses, filter coffee, “cowboy” percolators, even “professional” espresso makers. I maintain that the Bialetti filter produces the best cup of coffee: one full cup of espresso goodness. Not too strong, not too weak. Just perfect. Add some milk and you have an amazing café au lait. Of course, part of getting the best cup is using the right beans. If you’re brewing at home, you can afford to go a little fancy. Here’s what I’m currently using:

Yep, that’s right. A slice of Portlandia. Got this bag of espresso from Cafe Myriad, a rather upscale coffee joint. I think it was 15 dollars. A small bag like this is good for 30 cups or so. A keurig k-pack is $17.45 for 24. I’d say I’m still ahead. If you’re on a tighter budget you can get fair trade beans for cheaper ($10 a pound?) from Santropol in Montréal. Or whatever. Even generic stuff is probably fine (though I encourage fair trade if you can possibly afford it).
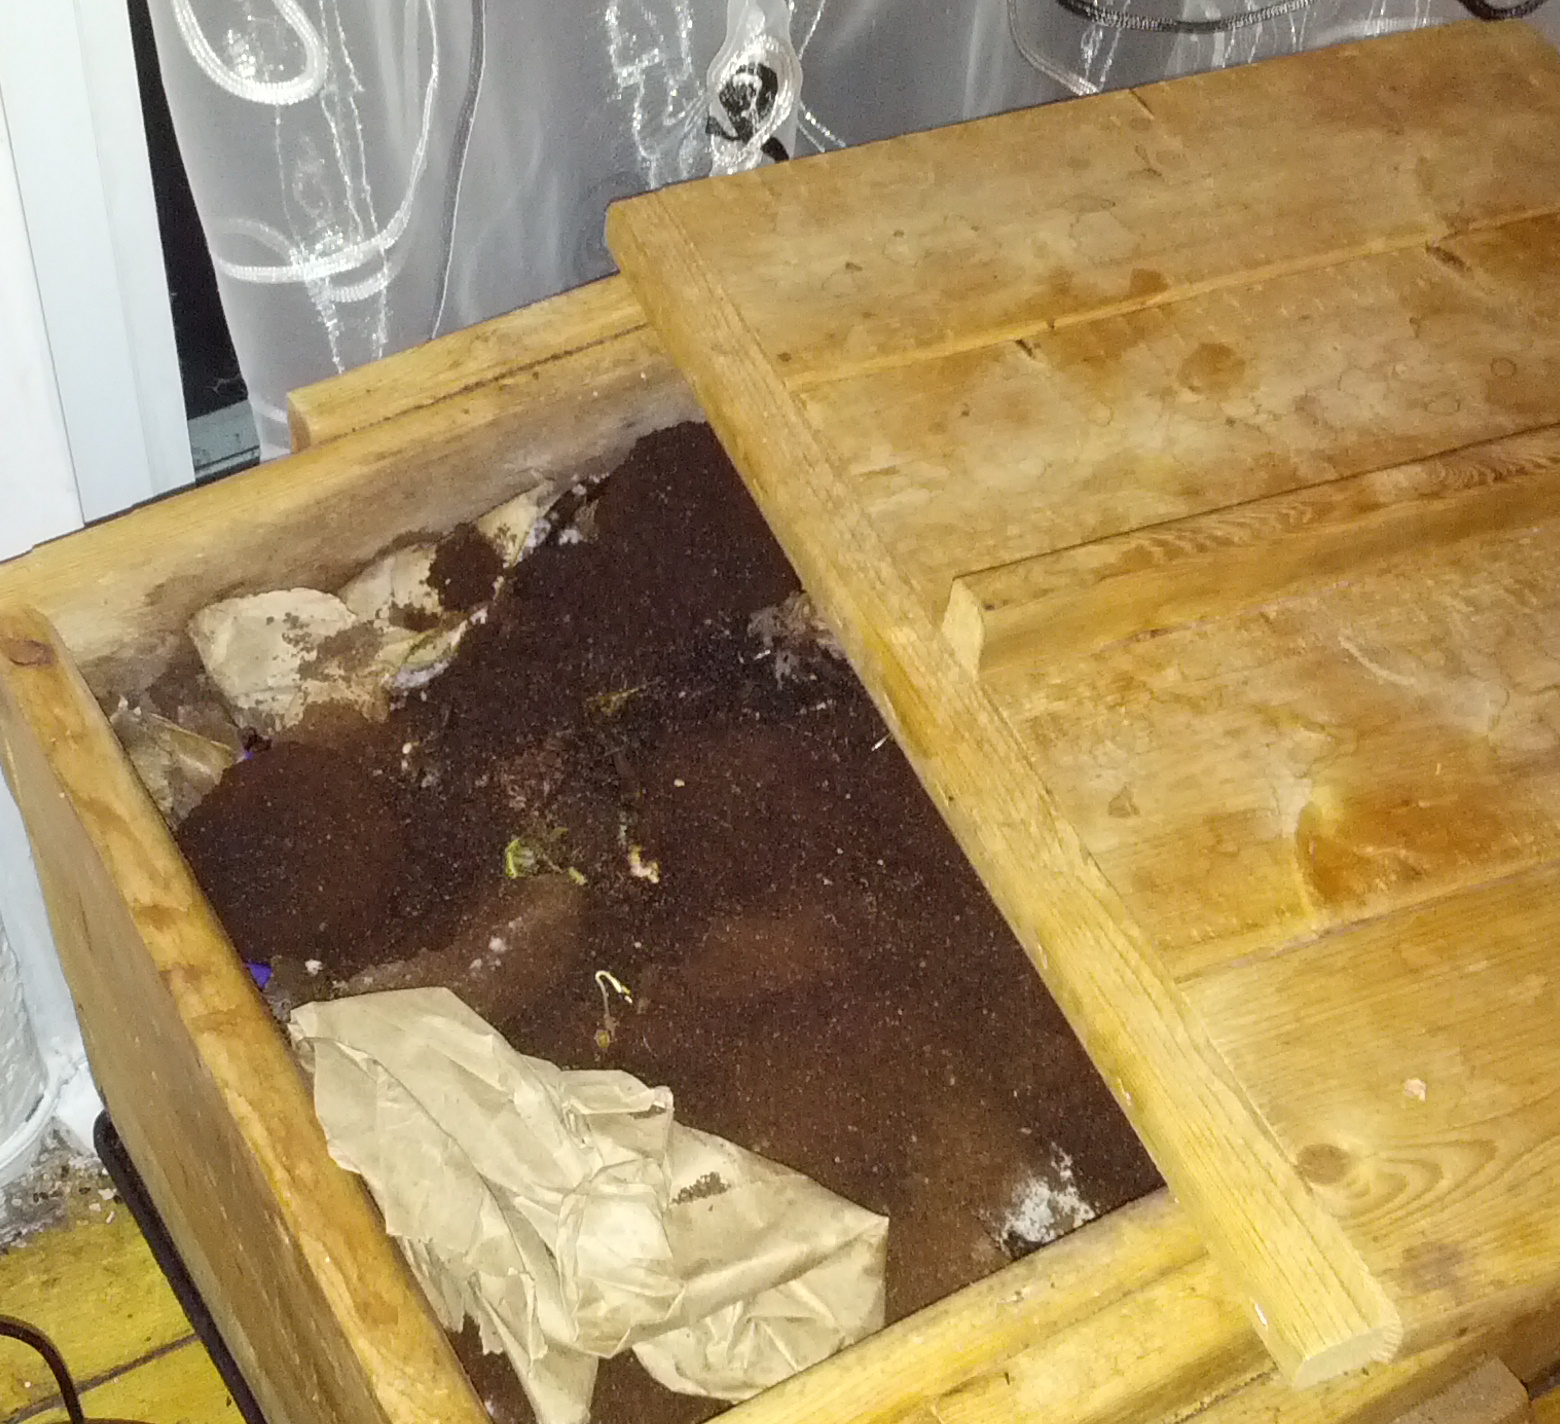
And what do I do with the waste? The only waste product of the Bialetti filter is coffee grinds. If I happened to live in a borough of Montréal with composting, I could dump it there. Unfortunately I don’t (if you live in NDG, please vote for these people in the upcoming municipal election; municipal composting is part of their platform, amongst other awesomeness) so I have a vermicompost. My morning ritual is dump yesterday’s coffee grinds into this bin:

… and then my numerous worms do the work of turning it into beautiful soil which I use in my balcony garden to grow tomotatos, kale, swiss chard, basil, and oregano.
What I want to emphasize most of all is that my ritual takes very little time. Scraping out and cleaning my Bialetti in the worm compost bin takes around minute. Refilling it with water and coffee takes maybe 30 seconds. Yes, once a year I have to take the worm trailings out of my vermicompost bin. That takes longer (maybe 30 minutes to an hour) but it’s a once a year thing and you avoid having to go to the store to buy fertilizer. Less waste. Way better coffee. Only a marginally more time spent. To me, this is a no-brainer.
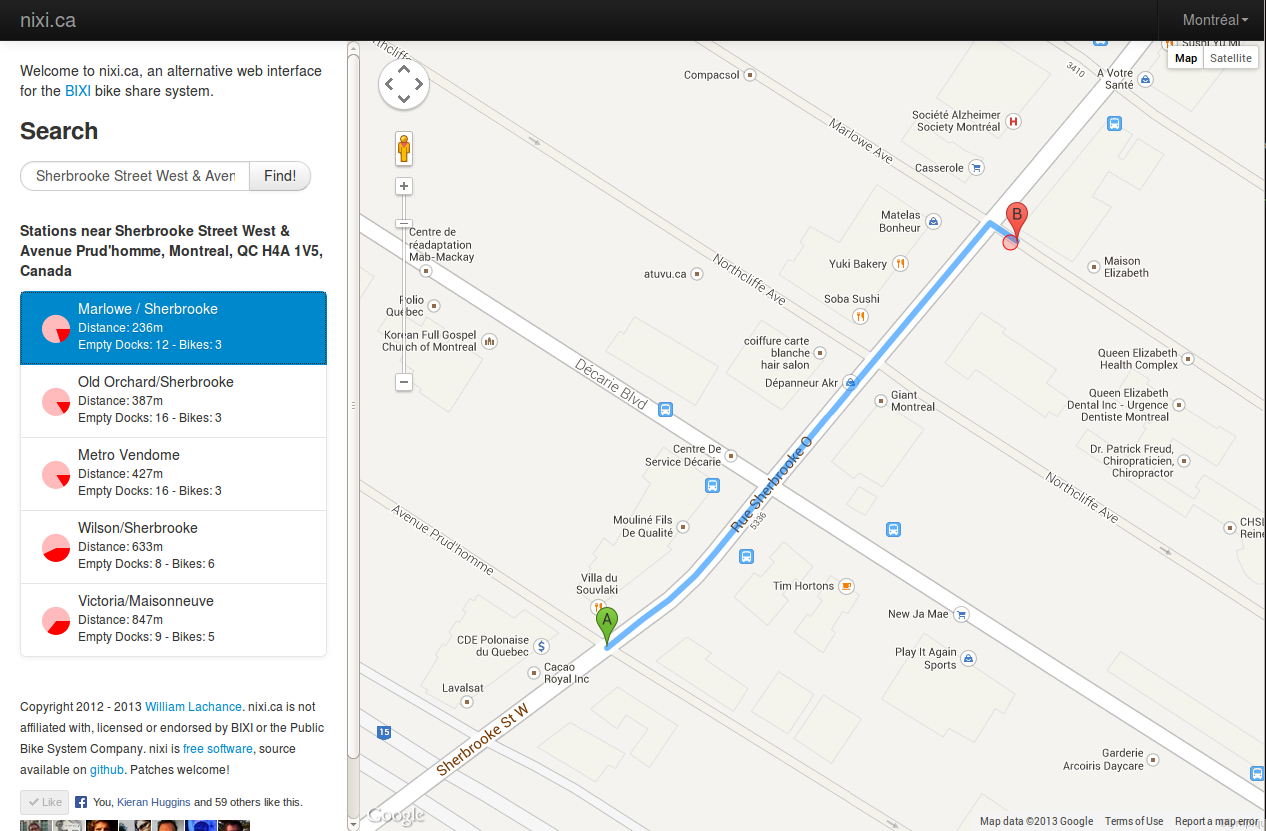
I’ve been working on a new, mobile friendly version of Nixi on-and-off for the past year and a bit. I’m not sure when it’s ever going to be finished, so I thought I might as well post the work-in-progress, which has these noteworthy improvements:
- Even faster than before (using the Bootstrap library behind the scenes, no longer using slow canvas library to update map)
- Sexier graphics (thanks to the aforementioned Bootstrap library)
- Now uses client side URLs to keep track of state as you navigate through the site. This allows you to bookmark a favorite spot (e.g. your home) and then go back to it later. For example, this link will give you a list of BIXI docks near Station C, the coworking space I belong to.
If you use BIXI at all, check it out and let me know what you think!

Today I did a quick port of Larry Doolittle’s ntpclient program to Android and FirefoxOS. Basically this lets you easily synchronize your device’s time to that of a central server. Yes, there’s lots and lots of Android “applications” which let you do this, but I wanted to be able to do this from the command line because that’s how I roll. If you’re interested, source and instructions are here:
https://github.com/wlach/ntpclient-android
For those curious, no, I didn’t just do this for fun. For next quarter, we want to write some Eideticker-based responsiveness tests for FirefoxOS and Android. For example, how long does it take from the time you tap on an icon in the homescreen on FirefoxOS to when the application is fully loaded? Or on Android, how long does it take to see a full list of sites in the awesomebar from the time you tap on the URL field and enter your search term?
Because an Eideticker test run involves two different machines (a host machine which controls the device and captures video of it in action, as well as the device itself), we need to use timestamps to really understand when and how events are being sent to the device. To do that reliably, we really need some easy way of synchronizing time between two machines (or at least accounting for the difference in their clocks, which amounts to about the same thing). NTP struck me as being the easiest, most standard way of doing this.