Periodically the discussion comes up about pruning away old stored Firefox build artifacts in S3. Each build is tens of megabytes, multiply that by the number of platforms we support and the set of revisions we churn through on a daily basis, and pretty soon you’re talking about real money.
This came up recently in a discussion about removing the legacy taskcluster deployment — what do we actually lose by cutting back our archive of integration builds? The main reason to keep them around is to facilitate bisection testing with mozregression, to find out when a bug was introduced. Up to now, discussions about this have been a bit hand-wavey: we do keep logs about who’s accessing old builds, but it’s never been clear whether it was mozregression accessing them or something else.
Happily, now that mozregression has some telemetry, it’s a little easier to get some answers on what people are actually doing. This query gets the distribution of build ages (launched or bisected) over the past 6 months, at a month long granularity.1 Ages are relative to the date mozregression was launched: for example, if someone asked for a build from May 2019 in June 2020, the number would be “13”.
SELECT metrics.string.usage_app AS app,
       metrics.string.usage_build_type AS build_type,
       DATE_DIFF(DATE(submission_timestamp), IF(LENGTH(metrics.datetime.usage_bad_date) > 0, PARSE_DATE('%Y-%m-%d', substr(metrics.datetime.usage_bad_date, 1, 10)), PARSE_DATE('%Y-%m-%d', substr(metrics.datetime.usage_launch_date, 1, 10))), MONTH) + 1 AS build_age
FROM `moz-fx-data-shared-prod`.org_mozilla_mozregression.usage
WHERE DATE(submission_timestamp) >= DATE_SUB(CURRENT_DATE(), INTERVAL 6 MONTH)
  AND client_info.app_display_version NOT LIKE '%dev%'
  AND LENGTH(metrics.string.usage_build_type) > 0
  AND (LENGTH(metrics.datetime.usage_bad_date) > 0
       OR LENGTH(metrics.datetime.usage_launch_date) > 0)
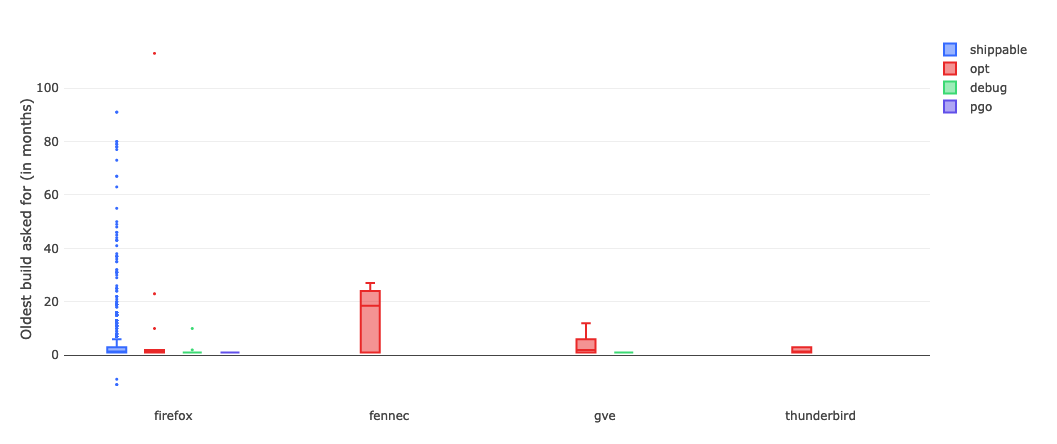
I ran this query on sql.telemetry.mozilla.org and generated a box plot, broken down by product and build type:
link (requires Mozilla LDAP)
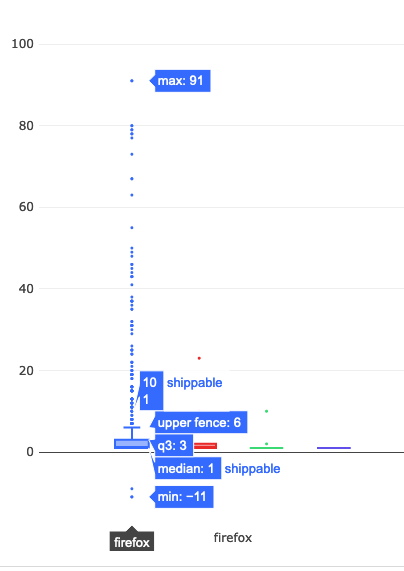
Unsurprisingly, Firefox shippable builds are the number one thing people try to bisect. Let’s take a little bit of a closer look at what’s going on there:
The median value is 1, which indicates that most people are bisecting builds within one month of the day in which mozregression was run. And the upper fence result is 6, suggesting that most of the time people are looking at a regression range that is within a 6 month range. However, looking more closely at the data points themselves (the little points in the chart above), there are a considerable number of outliers where a range greater than 20 months was asked for.
… which brings up to the question that we want to answer. Given that getting old builds isn’t that common (which we sort of knew already, based on the access patterns in the S3 logs), what is the impact of the times that we do? And it’s here where I have to throw up my hands and say “I don’t know” and suggest that we go back to empirical observation and user research.
You can go back to the thread I linked above, and see that core Firefox/Gecko developers find the ability to get a precise regression range for older revisions valuable. One thing that’s worth mentioning is that mozregression isn’t run that often, compared to a product that we ship: on the order of 50 to 100 times per a day. But when it comes to internal tooling, a small amount of use might have a big impact: if a mozregression invocation a developer a few hours (or more), that’s a real benefit to Firefox and Mozilla. The same argument might apply here, where a small number of bisections on older builds might have a disproportionate impact on the quality of the product.
(“This Week in Glean” is a series of blog posts that the Glean Team at Mozilla is using to try to communicate better about our work. They could be release notes, documentation, hopes, dreams, or whatever: so long as it is inspired by Glean. You can find an index of all TWiG posts online.)
This is a special guest post by non-Glean-team member William Lachance!
In the last year or so, there’s been a significant shift in the way we (Data Engineering) think about application-submitted data @ Mozilla, but although we have a new application-based SDK based on these principles (the Glean SDK), most of our data tools and documentation have not yet been updated to reflect this new state of affairs.
Much of this story is known inside Mozilla Data Engineering, but I thought it might be worth jotting them down into a blog post as a point of reference for people outside the immediate team. Knowing this may provide some context for some our activities and efforts over the next year or two, at least until our tools, documentation, and tribal knowledge evolve.
In sum, the key differences are:
- Instead of just one application we care about, there are many.
- Instead of just caring about (mostly1) one type of ping (the Firefox main ping), an individual application may submit many different types of pings in the course of their use.
- Instead of having both probes (histogram, scalar, or other data type) and bespoke parametric values in a JSON schema like the telemetry environment, there are now only metric types which are explicitly defined as part of each ping.
The new world is pretty exciting and freeing, but there is some new domain complexity that we need to figure out how to navigate. I’ll discuss that in my last section.
The Old World: Firefox is king
Up until roughly mid–2019, Firefox was the centre of Mozilla’s data world (with the occasional nod to Firefox for Android, which uses the same source repository). The Data Platform (often called “Telemetry”) was explicitly designed to cater to the needs of Firefox Developers (and to a lesser extent, product/program managers) and a set of bespoke tooling was built on top of our data pipeline architecture - this blog post from 2017 describes much of it.
In outline, the model is simple: on the client side, assuming a given user had not turned off Telemetry, during the course of a day’s operation Firefox would keep track of various measures, called “probes”. At the end of that duration, it would submit a JSON-encoded “main ping” to our servers with the probe information and a bunch of other mostly hand-specified junk, which would then find its way to a “data lake” (read: an Amazon S3 bucket). On top of this, we provided a python API (built on top of PySpark) which enabled people inside Mozilla to query all submitted pings across our usage population.
The only type of low-level object that was hard to keep track of was the list of probes: Firefox is a complex piece of software and there are many aspects of it we wanted to instrument to validate performance and quality of the product - especially on the more-experimental Nightly and Beta channels. To solve this problem, a probe dictionary was created to help developers find measures that corresponded to the product area that they were interested in.
On a higher-level, accessing this type of data using the python API quickly became slow and frustrating: the aggregation of years of Firefox ping data was hundreds of terabytes big, and even taking advantage of PySpark’s impressive capabilities, querying the data across any reasonably large timescale was slow and expensive. Here, the solution was to create derived datasets which enabled fast(er) access to pings and other derived measures, document them on docs.telemetry.mozilla.org, and then allow access to them through tools like sql.telemetry.mozilla.org or the Measurement Dashboard.
The New World: More of everything
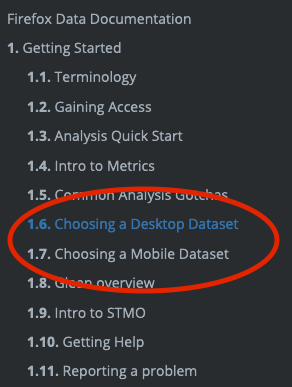
Even in the old world, other products that submitted telemetry existed (e.g. Firefox for Android, Firefox for iOS, the venerable FirefoxOS) but I would not call them first-class citizens. Most of our documentation treated them as (at best) weird edge cases. At the time of this writing, you can see this distinction clearly on docs.telemetry.mozilla.org where there is one (fairly detailed) tutorial called “Choosing a Desktop Dataset” while essentially all other products are lumped into “Choosing a Mobile Dataset”.
While the new universe of mobile products are probably the most notable addition to our list of things we want to keep track of, they’re only one piece of the puzzle. Really we’re interested in measuring all the things (in accordance with our lean data practices, of course) including tools we use to build our products like mozphab and mozregression.
In expanding our scope, we’ve found that mobile (and other products) have different requirements that influence what data we would want to send and when. For example, sending one blob of JSON multiple times per day might make sense for performance metrics on a desktop product (which is usually on a fast, unmetered network) but is much less acceptable on mobile (where every byte counts). For this reason, it makes sense to have different ping types for the same product, not just one. For example, Fenix (the new Firefox for Android) sends a tiny baseline ping2 on every run to (roughly) measure daily active users and a larger metrics ping sent on a (roughly) daily interval to measure (for example) a distribution of page load times.
Finally, we found that naively collecting certain types of data as raw histograms or inside the schema didn’t always work well. For example, encoding session lengths as plain integers would often produce weird results in the case of clock skew. For this reason, we decided to standardize on a set of well-defined metrics using Glean, which tries to minimize footguns. We explicitly no longer allow clients to submit arbitrary JSON or values as part of a telemetry ping: if you have a use case not covered by the existing metrics, make a case for it and add it to the list!
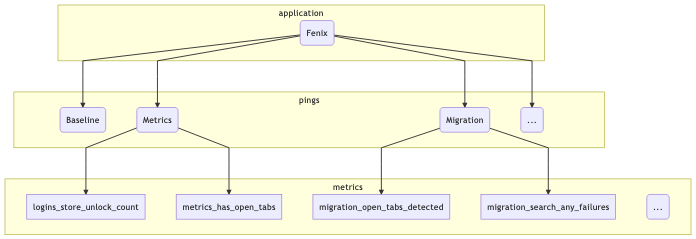
To illustrate this, let’s take a (subset) of what we might be looking at in terms of what the Fenix application sends:
mermaid source
At the top level we segment based on the “application” (just Fenix in this example). Just below that, there are the pings that this application might submit (I listed three: the baseline and metrics pings described above, along with a “migration” ping, which tracks metrics when a user migrates from Fennec to Fenix). And below that there are different types of metrics included in the pings: I listed a few that came out of a quick scan of the Fenix BigQuery tables using my prototype schema dictionary.
This is actually only the surface-level: at the time of this writing, Fenix has no fewer than 12 different ping types and many different metrics inside each of them.3 On a client level, the new Glean SDK provides easy-to-use primitives to help developers collect this type of information in a principled, privacy-preserving way: for example, data review is built into every metric type. But what about after it hits our ingestion endpoints?
Hand-crafting schemas, data ingestion pipelines, and individualized ETL scripts for such a large matrix of applications, ping types, and measurements would quickly become intractable. Instead, we (Mozilla Data Engineering) refactored our data pipeline to parse out the information from the Glean schemas and then create tables in our BigQuery datastore corresponding to what’s in them - this has proceeded as an extension to our (now somewhat misnamed) probe-scraper tool.
You can then query this data directly (see accessing glean data) or build up a derived dataset using our SQL-based ETL system, BigQuery-ETL. This part of the equation has been working fairly well, I’d say: we now have a diverse set of products producing Glean telemetry and submitting it to our servers, and the amount of manual effort required to add each application was minimal (aside from adding new capabilities to the platform as we went along).
What hasn’t quite kept pace is our tooling to make navigating and using this new collection of data tractable.
What could bring this all together?
As mentioned before, this new world is quite powerful and gives Mozilla a bunch of new capabilities but it isn’t yet well documented and we lack the tools to easily connect the dots from “I have a product question” to “I know how to write an SQL query / Spark Job to answer it” or (better yet) “this product dashboard will answer it”.
Up until now, our defacto answer has been some combination of “Use the probe dictionary / telemetry.mozilla.org” and/or “refer to docs.telemetry.mozilla.org”. I submit that we’re at the point where these approaches break down: as mentioned above, there are many more types of data we now need to care about than just “probes” (or “metrics”, in Glean-parlance). When we just cared about the main ping, we could write dataset documentation for its recommended access point (main_summary) and the raw number of derived datasets was managable. But in this new world, where we have N applications times M ping types, the number of canonical ping tables are now so many that documenting them all on docs.telemetry.mozilla.org no longer makes sense.
A few months ago, I thought that Google’s Data Catalog (billed as offering “a unified view of all your datasets”) might provide a solution, but on further examination it only solves part of the problem: it provides only a view on your BigQuery tables and it isn’t designed to provide detailed information on the domain objects we care about (products, pings, measures, and tools). You can map some of the properties from these objects onto the tables (e.g. adding a probe’s description field to the column representing it in the BigQuery table), but Data Calalog’s interface to surfacing and filtering through this information is rather slow and clumsy and requires detailed knowledge of how these higher level concepts relate to BigQuery primitives.
Instead, what I think we need is a new system which allows a data practitioner (Data Scientist, Firefox Engineer, Data Engineer, Product Manager, whoever) to visualize the relevant set of domain objects relevant to their product/feature of interest quickly then map them to specific BigQuery tables and other resources (e.g. visualizations using tools like GLAM) which allow people to quickly answer questions so we can make better products. Basically, I am thinking of some combination of:
- The existing probe dictionary (derived from existing product metadata)
- A new “application” dictionary (derived from some simple to-be-defined application metadata description)
- A new “ping” dictionary (derived from existing product metadata)
- A BigQuery schema dictionary (I wrote up a prototype of this a couple weeks ago) to map between these higher-level objects and what’s in our low-level data store
- Documentation for derived datasets generated by BigQuery-ETL (ideally stored alongside the ETL code itself, so it’s easy to keep up to date)
- A data tool dictionary describing how to easily access the above data in various ways (e.g. SQL query, dashboard plot, etc.)
This might sound ambitious, but it’s basically just a system for collecting and visualizing various types of documentation— something we have proven we know how to do. And I think a product like this could be incredibly empowering, not only for the internal audience at Mozilla but also the external audience who wants to support us but has valid concerns about what we’re collecting and why: since this system is based entirely on systems which are already open (inside GitHub or Mercurial repositories), there is no reason we can’t make it available to the public.
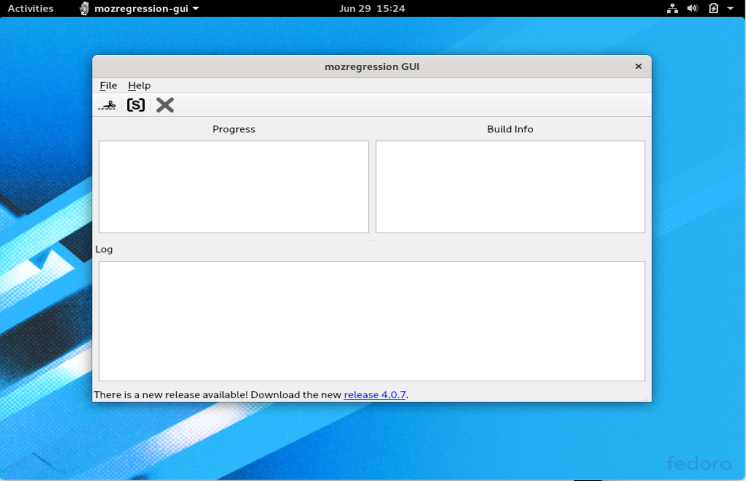
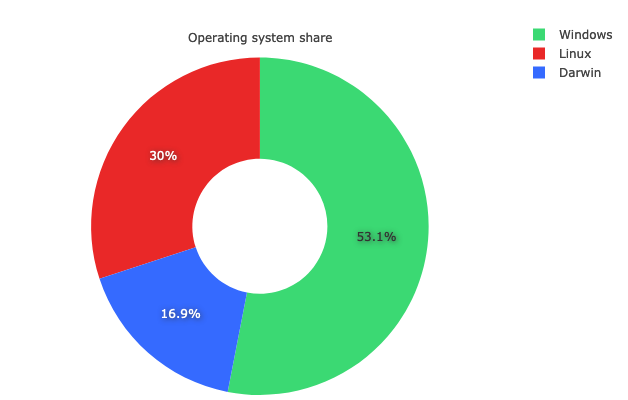
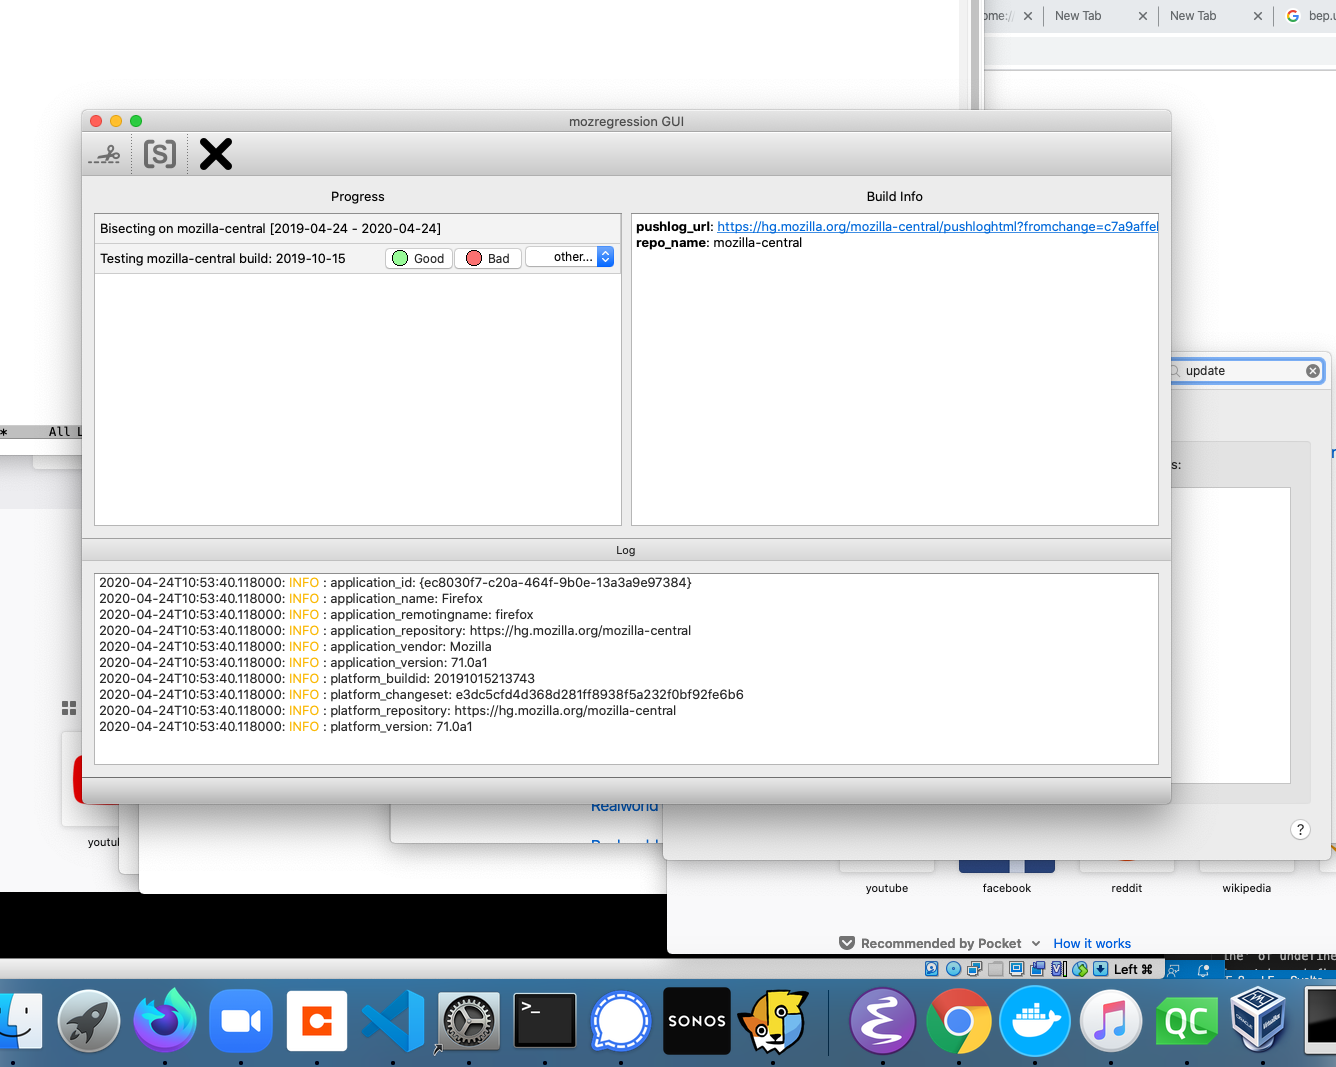
Thanks to @AnAverageHuman, mozregression once again has an easy to use and install GUI version for Linux! This used to work a few years ago, but got broken with some changes in the mozregression-python2 era and didn’t get resolved until now:
This is an area where using telemetry in mozregression can help us measure the impact of a change like this: although Windows still dominates in terms of marketshare, Linux is very widely used by contributors — of the usage of mozregression in the past 2 months, fully 30% of the sessions were on Linux (and it is possible we were undercounting that due to bug 1646402):
link to query (internal-only)
It will be interesting to watch the usage numbers for Linux evolve over the next few months. In particular, I’m curious to see what percentage of users on that platform prefer a GUI.
Appendix: reducing mozregression-GUI’s massive size
One thing that’s bothered me a bunch lately is that the mozregression GUI’s size is massive and this is even more apparent on Linux, where the initial distribution of the GUI came in at over 120 megabytes! Why so big? There were a few reasons:
- PySide2 (the GUI library we use) is very large (10s of megabytes), and PyInstaller packages all of it by default into your application distribution.
- The binary/rust portions of the Glean Python SDK were been built with debugging information included (basically as a carry-over when it was a pre-alpha product), which made it 38 megabytes big (!) on Linux.
- On Linux at least, a large number of other system libraries are packaged into the distribution.
A few aspects of this were under our control: Ian Moody (:Kwan) and myself crafted a script to manually remove unneeded PySide2 libraries as part of the packaging process. The Glean team was awesome-as-always and quickly rebuilt Glean without debugging information (this was basically an oversight). Finally, I managed to shave off a few more megabytes by reverting the Linux build to an earlier version of Ubuntu (Xenial), which is something I had been meaning to do anyway.
Even after doing all of these things, the end result is still a little underwhelming: the mozregression GUI distribution on Linux is still 79.5 megabytes big. There are probably other things we could do, but we’re definitely entering the land of diminishing returns.
Honestly, my main takeaway is just not to build an application like this in Python unless you absolutely have to (e.g. you’re building an application which needs system-level access). The web is a pretty wonderful medium for creating graphical applications these days, and by using it you sidestep these type of installation issues.
I’ve been thinking a lot about markdown, presentation, dashboards, and other frontendy sorts of things lately, partly inspired by my work on Iodide last year, partly inspired by my recent efforts on improving docs.telemetry.mozilla.org. I haven’t fully fleshed out my thoughts on this yet, but in general I think blogs (for some value of “blog”) are still a great way to communicate ideas and concepts to an interested audience.
Like many organizations, Mozilla’s gone down the path of Google Docs, Zoom and Slack which makes me more than a little sad: good ideas disappear down the memory hole super quickly with these tools, not to mention the fact that they are closed-by-default (even to people inside Mozilla!). My view on “open” is a bit more nuanced than it used to be: I no longer think everything need be all-public, all-the-time— but I still think talking about and through our ideas (even if imperfectly formed or stated) with a broad audience builds trust and leads to better outcomes.
Is there some way we can blend some of these old school ideas (blogs, newsgroups, open discussion forums) with better technology and social practices? Let’s find out.
(this post is aimed primarily at an internal audience, but I thought I’d go ahead and make it public as a blog post)
I’ve been thinking a bunch over the past few months about the Mozilla data organization’s documentation story. We have a first class data platform here at Mozilla, but using it to answer questions, especially for newer employees, can be quite intimidating. As we continue our collective journey to becoming a modern data-driven organization, part of the formula for unlocking this promise is making the tools and platforms we create accessible to a broad internal audience.
My data peers are a friendly group of people and we have historically been good at answering questions on forums like the #fx-metrics slack channel: we’ll keep doing this. That said, our time is limited: we need a common resource for helping bring people up to speed on how to use the data platform to answer common questions.
Our documentation site, docs.telemetry.mozilla.org, was meant to be this resource: however in the last couple of years an understanding of its purpose has been (at least partially) lost and it has become somewhat overgrown with content that isn’t very relevant to those it’s intended to help.
This post’s goal is to re-establish a mission for our documentation site — towards the end, some concrete proposals on what to change are also outlined.
Setting the audience
docs.telemetry.mozilla.org was and is meant to be a resource useful for data practitioners within Mozilla.
Examples of different data practioners and their use cases:
- A data scientist performing an experiment analysis
- A data analyst producing a report on the effectiveness of a recent marketing campaign
- A Firefox engineer trying to understand the performance characteristics of a new feature
- A technical product manager trying to understand the characteristics of a particular user segment
- A quality assurance engineer trying to understand the severity of a Firefox crash
There are a range of skills that these different groups bring to the table, but there are some common things we expect a data practitioner to have, whatever their formal job description:
- At least some programming and analytical experience
- Comfortable working with and understanding complex data systems with multiple levels of abstraction (for example: the relationship between the Firefox browser which produces Telemetry data and the backend system which processes it)
- The time necessary to dig into details
This also excludes a few groups:
- Senior leadership or executives: they are of course free to use docs.telemetry.mozilla.org if helpful, but it is expected that the type of analytical work covered by the documentation will normally be done by a data practitioner and that relevant concepts and background information will be explained to them (in the form of high-level dashboards, presentations, etc.).
- Data Engineering: some of the material on docs.telemetry.mozilla.org may be incidentally useful to this internal audience, but explaining the full details of the data platform itself belongs elsewhere.
What do these users need?
In general, a data practitioner is trying to answer a specific set of questions in the context of an exploration. There are a few things that they need:
- A working knowledge of how to use the technological tools to answer the questions they might have: for example, how to create a SQL query counting the median value of a particular histogram for a particular usage segment.
- A set of guidelines on best practices on how to measure specific things: for example, we want our people using our telemetry systems to use well-formulated practices for measuring things like “Monthly Active Users” rather than re-inventing such things themselves.
What serves this need?
A few years ago, Ryan Harter did an extensive literature review on writing documentation on technical subjects - the take away from this exploration is that the global consensus is that we should focus most of our attention on writing practical tutorials which enables our users to perform specific tasks in the service of the above objective.
There is a proverb, allegedly attributed to Confucius which goes something like this:
“I hear and I forget. I see and I remember. I do and I understand.”
The understanding we want to build is how to use our data systems and tools to answer questions. Some knowledge of how our data platform works is no doubt necessary to accomplish this, but it is mostly functional knowledge we care about imparting to data practitioners: the best way to build this understanding is to guide users in performing tasks.
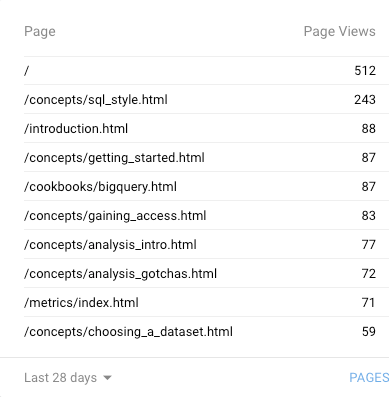
This makes sense intuitively, but it is also borne out by the data that this is what our users are looking for. Looking through the top pages on Google Analytics, virtually all of them1 refer either to a cookbook or howto guide:
Happily, this allows us to significantly narrow our focus for docs.telemetry.mozilla.org. We no longer need to worry about:
- Providing lists or summaries of data tools available inside Mozilla2: we can talk about tools only as needed in the context of tasks they want to accomplish. We may want to keep such a list handy elsewhere for some other reason (e.g. internal auditing purposes), but we can safely say that it belongs somewhere else, like the Mozilla wiki, mana, or the telemetry.mozilla.org portal.
- Detailed reference on the technical details of the data platform implementation. Links to this kind of material can be surfaced inside the documentation where relevant, but it is expected that an implementation reference will normally be stored and presented within the context of the tools themselves (a good example would be the existing documentation for GCP ingestion).
- Detailed reference on all data sets, ping types, or probes: hand-written documentation for this kind of information is difficult to keep up to date with manual processes3 and is best generated automatically and browsed with tools like the probe dictionary.
- Detailed reference material on how to submit Telemetry. While an overview of how to think about submitting telemetry may be in scope (recall that we consider Firefox engineers a kind of data practitioner), the details are really a seperate topic that is better left to another resource which is closer to the implementation (for example, the Firefox Source Documentation or the Glean SDK reference).
Scanning through the above, you’ll see a common theme: avoid overly detailed reference material. The above is not to say that we should avoid background documentation altogether. For example, an understanding of how our data pipeline works is key to understanding how up-to-date a dashboard is expected to be. However, this type of documentation should be written bearing in mind the audience (focusing on what they need to know as data practitioners) and should be surfaced towards the end of the documentation as supporting material.
As an exception, there is also a very small amount of reference documentation which we want to put at top-level because it is so important: for example the standard metrics page describes how we define “MAU” and “DAU”: these are measures that we want to standardize in the organization, and not have someone re-invent every time they produce an analysis or report. However, we should be very cautious about how much of this “front facing” material we include: if we overwhelm our audience with details right out of the gate, they are apt to ignore them.
Concrete actions
- We should continue working on tutorials on how to perform common tasks: this includes not only the low-level guides that we currently have (e.g. BigQuery and SQL tutorials) but also information on how to effectively use our higher-level, more accessible tools like GLAM and GUD to answer questions.
- Medium term, we should remove the per-dataset documentation and replace it with a graphical tool for browsing this type of information (perhaps Google Data Catalog). Since this is likely to be a rather involved project, we can keep the existing documentation for now — but for new datasets, we should encourage their authors to write tutorials on how to use them effectively (assuming they are of broad general interest) instead of hand-creating schema definitions that are likely to go out of date quickly.
- We should set clear expectations and guidelines of what does and doesn’t belong on docs.telemetry.mozilla.org as part of a larger style guide. This style guide should be referenced somewhere prominent (perhaps as part of a pull request template) so that historical knowledge of what this resource is for isn’t lost.
(“This Week in Glean” is a series of blog posts that the Glean Team at Mozilla is using to try to communicate better about our work. They could be release notes, documentation, hopes, dreams, or whatever: so long as it is inspired by Glean. You can find an index of all TWiG posts online.)
This is a special guest post by non-Glean-team member William Lachance!
This is a continuation of an exploration of adding Glean-based telemetry to a python application, in this case mozregression, a tool for automatically finding the source of Firefox regressions (breakage).
When we left off last time, we had written some test scripts and verified that the data was visible in the debug viewer.
Adding Telemetry to mozregression itself
In many ways, this is pretty similar to what I did inside the sample application: the only significant difference is that these are shipped inside a Python application that is meant to be be installable via pip. This means we need to specify the pings.yaml and metrics.yaml (located inside the mozregression subirectory) as package data inside setup.py:
setup(
    name="mozregression",
    ...
    package_data={"mozregression": ["*.yaml"]},
    ...
)
There were also a number of Glean SDK enhancements which we determined were necessary. Most notably, Michael Droettboom added 32-bit Windows wheels to the Glean SDK, which we need to make building the mozregression GUI on Windows possible. In addition, some minor changes needed to be made to Glean’s behaviour for it to work correctly with a command-line tool like mozregression — for example, Glean used to assume that Telemetry would always be disabled via a GUI action so that it would send a deletion ping, but this would obviously not work in an application like mozregression where there is only a configuration file — so for this case, Glean needed to be modified to check if it had been disabled between runs.
Many thanks to Mike (and others on the Glean team) for so patiently listening to my concerns and modifying Glean accordingly.
Getting Data Review
At Mozilla, we don’t just allow random engineers like myself to start collecting data in a product that we ship (even a semi-internal like mozregression). We have a process, overseen by Data Stewards to make sure the information we gather is actually answering important questions and doesn’t unnecessarily collect personally identifiable information (e.g. email addresses).
You can see the specifics of how this worked out in the case of mozregression in bug 1581647.
Documentation
Glean has some fantastic utilities for generating markdown-based documentation on what information is being collected, which I have made available on GitHub:
https://github.com/mozilla/mozregression/blob/master/docs/glean/metrics.md
The generation of this documentation is hooked up to mozregression’s continuous integration, so we can sure it’s up to date.
I also added a quick note to mozregression’s web site describing the feature, along with (very importantly) instructions on how to turn it off.
Enabling Data Ingestion
Once a Glean-based project has passed data review, getting our infrastructure to ingest it is pretty straightforward. Normally we would suggest just filing a bug and let us (the data team) handle the details, but since I’m on that team, I’m going to go a (little bit) of detail into how the sausage is made.
Behind the scenes, we have a collection of ETL (extract-transform-load) scripts in the probe-scraper repository which are responsible for parsing the ping and probe metadata files that I added to mozregression in the step above and then automatically creating BigQuery tables and updating our ingestion machinery to insert data passed to us there.
There’s quite a bit of complicated machinery being the scenes to make this all work, but since it’s already in place, adding a new thing like this is relatively simple. The changeset I submitted as part of a pull request to probe-scraper was all of 9 lines long:
diff --git a/repositories.yaml b/repositories.yaml
index dffcccf..6212e55 100644
--- a/repositories.yaml
+++ b/repositories.yaml
@@ -239,3 +239,12 @@ firefox-android-release:
     - org.mozilla.components:browser-engine-gecko-beta
     - org.mozilla.appservices:logins
     - org.mozilla.components:support-migration
+mozregression:
+  app_id: org-mozilla-mozregression
+  notification_emails:
+    - wlachance@mozilla.com
+  url: 'https://github.com/mozilla/mozregression'
+  metrics_files:
+    - 'mozregression/metrics.yaml'
+  ping_files:
+    - 'mozregression/pings.yaml'
A Pretty Graph
With the probe scraper change merged and deployed, we can now start querying! A number of tables are automatically created according to the schema outlined above: notably “live” and “stable” tables corresponding to the usage ping. Using sql.telemetry.mozilla.org we can start exploring what’s out there. Here’s a quick query I wrote up:
SELECT DATE(submission_timestamp) AS date,
       metrics.string.usage_variant AS variant,
       count(*),
FROM `moz-fx-data-shared-prod`.org_mozilla_mozregression_stable.usage_v1
WHERE DATE(submission_timestamp) >= '2020-04-14'
  AND client_info.app_display_version NOT LIKE '%.dev%'
GROUP BY date, variant;
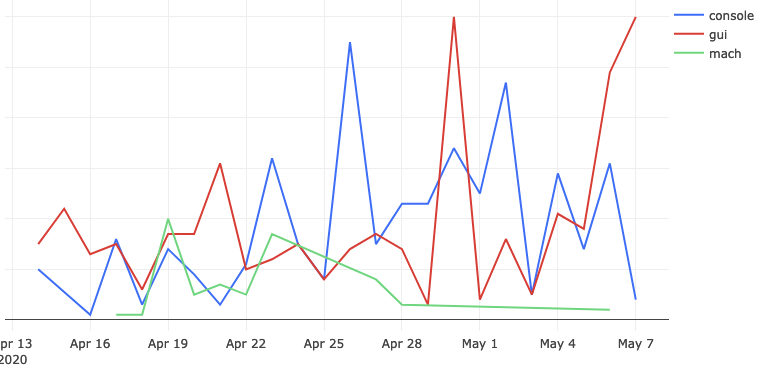
… which generates a chart like this:
This chart represents the absolute volume of mozregression usage since April 14th 2020 (around the time when we first released a version of mozregression with Glean telemetry), grouped by mozregression “variant” (GUI, console, and mach) and date - you can see that (unsurprisingly?) the GUI has the highest usage. I’ll talk about this more in an upcoming installment, speaking of…
Next Steps
We’re not done yet! Next time, we’ll look into making a public-facing dashboard demonstrating these results and making an aggregated version of the mozregression telemetry data publicly accessible to researchers and the general public. If we’re lucky, there might even be a bit of data science. Stay tuned!
Just a quick note that, as a side-effect of the work I mentioned a while ago to add telemetry to mozregression, mozregression now has a graphical Mac client! It’s a bit of a pain to install (since it’s unsigned), but likely worlds easier for the average person to get going than the command-line version. Please feel free to point people to it if you’re looking to get a regression range for a MacOS-specific problem with Firefox.
More details: The Glean Python SDK, which mozregression now uses for telemetry, requires Python 3. This provided the impetus to port the GUI itself to Python 3 and PySide2 (the modern incarnation of PyQt), which brought with it a much easier installation/development experience for the GUI on platforms like Mac and Linux.
I haven’t gotten around to producing GUI binaries for the Linux yet, but it should not be much work.
Speaking of Glean, mozregression, and Telemetry, stay tuned for more updates on that soon. It’s been an adventure!
(“This Week in Glean” is a series of blog posts that the Glean Team at Mozilla is using to try to communicate better about our work. They could be release notes, documentation, hopes, dreams, or whatever: so long as it is inspired by Glean. You can find an index of all TWiG posts online.)
This is a special guest post by non-Glean-team member William Lachance!
As I mentioned last time I talked about mozregression, I have been thinking about adding some telemetry to the system to better understand the usage of this tool, to justify some part of Mozilla spending some cycles maintaining and improving it (assuming my intuition that this tool is heavily used is confirmed).
Coincidentally, the Telemetry client team has been working on a new library for measuring these types of things in a principled way called Glean, which even has python bindings! Using this has the potential in saving a lot of work: not only does Glean provide a framework for submitting data, our backend systems are automatically set up to process data submitted via into Glean into BigQuery tables, which can then easily be queried using tools like sql.telemetry.mozilla.org.
I thought it might be useful to go through some of what I’ve been exploring, in case others at Mozilla are interested in instrumenting their pet internal tools or projects. If this effort is successful, I’ll distill these notes into a tutorial in the Glean documentation.
Initial steps: defining pings and metrics
The initial step in setting up a Glean project of any type is to define explicitly the types of pings and metrics. You can look at a “ping” as being a small bucket of data submitted by a piece of software in the field. A “metric” is something we’re measuring and including in a ping.
Most of the Glean documentation focuses on browser-based use-cases where we might want to sample lots of different things on an ongoing basis, but for mozregression our needs are considerably simpler: we just want to know when someone has used it along with a small number of non-personally identifiable characteristics of their usage, e.g. the mozregression version number and the name of the application they are bisecting.
Glean has the concept of event pings, but it seems like those are there more for a fine-grained view of what’s going on during an application’s use. So let’s define a new ping just for ourselves, giving it the unimaginative name “usage”. This goes in a file called pings.yaml:
---
$schema: moz://mozilla.org/schemas/glean/pings/1-0-0

usage:
  description: >
    A ping to record usage of mozregression
  include_client_id: true
  notification_emails:
    - wlachance@mozilla.com
  bugs:
    - http://bugzilla.mozilla.org/123456789/
  data_reviews:
    - http://example.com/path/to/data-review
We also need to define a list of things we want to measure. To start with, let’s just test with one piece of sample information: the app we’re bisecting (e.g. “Firefox” or “Gecko View Example”). This goes in a file called metrics.yaml:
---
$schema: moz://mozilla.org/schemas/glean/metrics/1-0-0

usage:
  app:
    type: string
    description: >
      The name of the app being bisected
    notification_emails:
      - wlachance@mozilla.com
    bugs:
      - https://bugzilla.mozilla.org/show_bug.cgi?id=1581647
    data_reviews:
      - http://example.com/path/to/data-review
    expires: never
    send_in_pings:
      - usage
The data_reviews sections in both of the above are obviously bogus, we will need to actually get data review before landing and using this code, to make sure that we’re in conformance with Mozilla’s data collection policies.
Testing it out
But in the mean time, we can test our setup with the Glean debug pings viewer by setting a special tag (mozregression-test-tag) on our output. Here’s a small python script which does just that:
from pathlib import Path
from glean import Glean, Configuration
from glean import (load_metrics,
                   load_pings)

mozregression_path = Path.home() / '.mozilla2' / 'mozregression'

Glean.initialize(
    application_id="mozregression",
    application_version="0.1.1",
    upload_enabled=True,
    configuration=Configuration(
      ping_tag="mozregression-test-tag"
    ),
    data_dir=mozregression_path / "data"
)
Glean.set_upload_enabled(True)

pings = load_pings("pings.yaml")
metrics = load_metrics("metrics.yaml")

metrics.usage.app.set("reality")
pings.usage.submit()
Running this script on my laptop, I see that a respectable JSON payload was delivered to and processed by our servers:
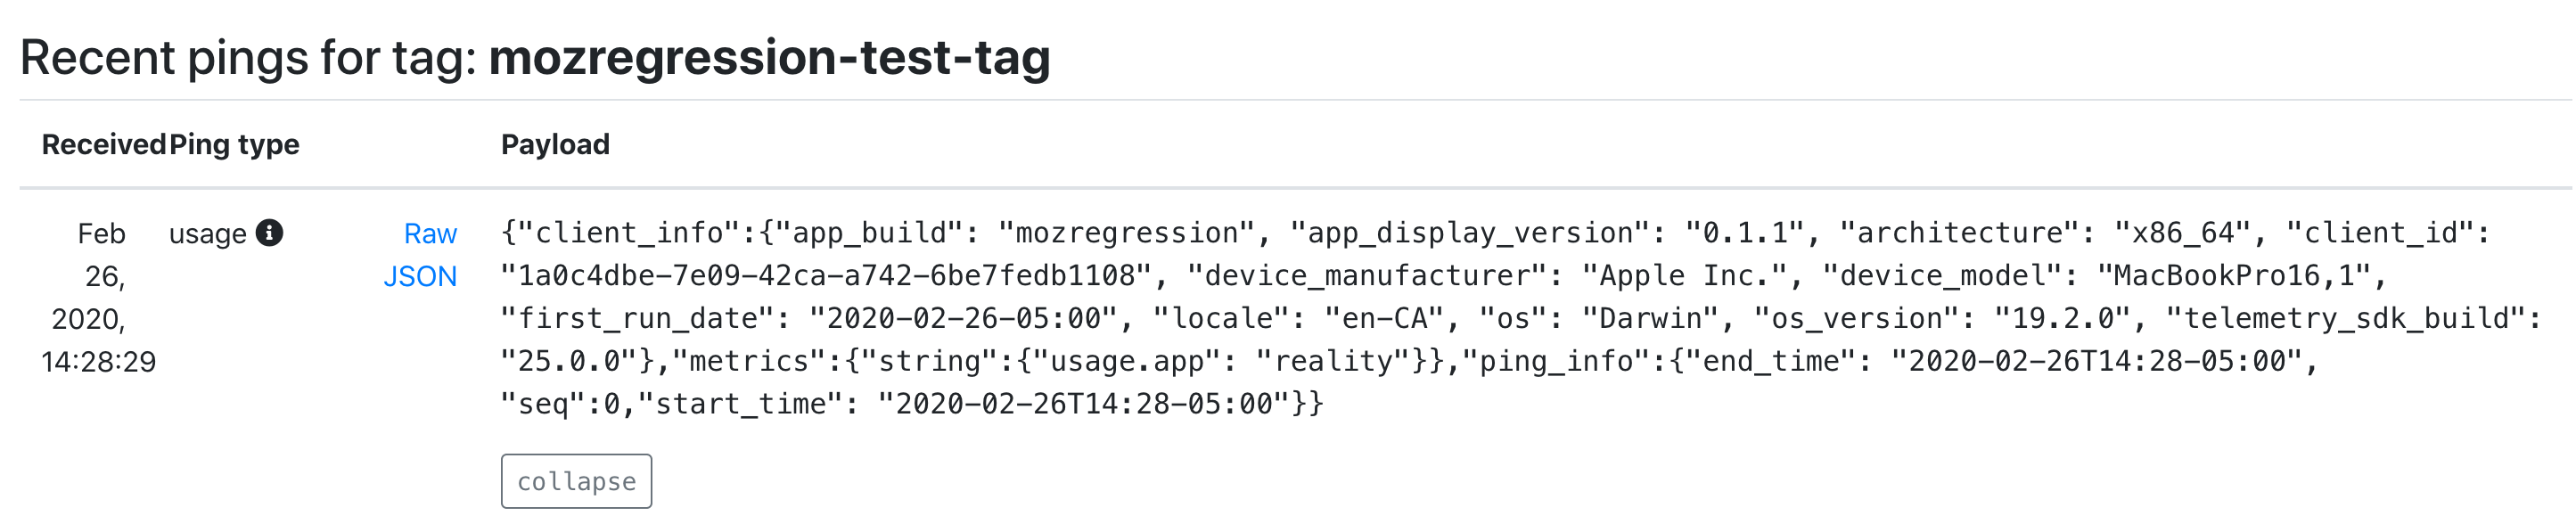
As you can see, we’re successfully processing both the “version” number of mozregression, some characteristics of the machine sending the information (my MacBook in this case), as well as our single measure. We also have a client id, which should tell us roughly how many distinct installations of mozregression are sending pings. This should be more than sufficient for an initial “mozregression usage dashboard”.
Next steps
There are a bunch of things I still need to work through before landing this inside mozregression itself. Notably, the Glean python bindings are python3-only, so we’ll need to port the mozregression GUI to python 3 before we can start measuring usage there. But I’m excited at how quickly this work is coming together: stay tuned for part 2 in a few weeks.
Lately the data engineering team has been looking into productionizing (i.e. running in Airflow) a bunch of models that the data science team has been producing. This often involves languages and environments that are a bit outside of our comfort zone — for example, the next version of Mission Control relies on the R-stan library to produce a model of expected crash behaviour as Firefox is released.
To make things as simple and deterministic as possible, we’ve been building up Docker containers to run/execute this code along with their dependencies, which makes things nice and reproducible. My initial thought was to use just the language-native toolchains to build up my container for the above project, but quickly found a number of problems:
- For local testing, Docker on Mac is slow: when doing a large number of statistical calculations (as above), you can count on your testing iterations taking 3 to 4 (or more) times longer.
- On initial setup, the default R packaging strategy is to have the user of a package like R-stan recompile from source. This can take forever if you have a long list of dependencies with C-compiled extensions (pretty much a given if you’re working in the data space): rebuilding my initial docker environment for missioncontrol-v2 took almost an hour. This isn’t just a problem for local development: it also makes continuous integration using a service like Circle or Travis expensive and painful.
I had been vaguely aware of Conda for a few years, but didn’t really understand its value proposition until I started working on the above project: why bother with a heavyweight package manager when you already have Docker to virtualize things? The answer is that it solves both of the above problems: for local development, you can get something more-or-less identical to what you’re running inside Docker with no performance penalty whatsoever. And for building the docker container itself, Conda’s package repository contains pre-compiled versions of all the dependencies you’d want to use for something like this (even somewhat esoteric libraries like R-stan are available on conda-forge), which brought my build cycle times down to less than 5 minutes.
tl;dr: If you have a bunch of R / python code you want to run in a reproducible manner, consider Conda.
For the last year, we’ve been gradually migrating our backend Telemetry systems from AWS to GCP. I’ve been helping out here and there with this effort, most recently porting a job we used to detect slow tab spinners in Firefox nightly, which produced a small dataset that feeds a small adhoc dashboard which Mike Conley maintains. This was a relatively small task as things go, but it highlighted some features and improvements which I think might be broadly interesting, so I decided to write up a small blog post about it.
Essentially all this dashboard tells you is what percentage of the Firefox nightly population saw a tab spinner over the past 6 months. And of those that did see a tab spinner, what was the severity? Essentially we’re just trying to make sure that there are no major regressions of user experience (and also that efforts to improve things bore fruit):
![]()
Pretty simple stuff, but getting the data necessary to produce this kind of dashboard used to be anything but trivial: while some common business/product questions could be answered by a quick query to clients_daily, getting engineering-specific metrics like this usually involved trawling through gigabytes of raw heka encoded blobs using an Apache Spark cluster and then extracting the relevant information out of the telemetry probe histograms (in this case, FX_TAB_SWITCH_SPINNER_VISIBLE_MS and FX_TAB_SWITCH_SPINNER_VISIBLE_LONG_MS) contained therein.
The code itself was rather complicated (take a look, if you dare) but even worse, running it could get very expensive. We had a 14 node cluster churning through this script daily, and it took on average about an hour and a half to run! I don’t have the exact cost figures on hand (and am not sure if I’d be authorized to share them if I did), but based on a back of the envelope sketch, this one single script was probably costing us somewhere on the order of $10-$40 a day (that works out to between $3650-$14600 a year).
With our move to BigQuery, things get a lot simpler! Thanks to the combined effort of my team and data operations[1], we now produce “stable” ping tables on a daily basis with all the relevant histogram data (stored as JSON blobs), queryable using relatively vanilla SQL. In this case, the data we care about is in telemetry.main (named after the main ping, appropriately enough). With the help of a small JavaScript UDF function, all of this data can easily be extracted into a table inside a single SQL query scheduled by sql.telemetry.mozilla.org.
CREATE TEMP FUNCTION
  udf_js_json_extract_highest_long_spinner (input STRING)
  RETURNS INT64
  LANGUAGE js AS """
    if (input == null) {
      return 0;
    }
    var result = JSON.parse(input);
    var valuesMap = result.values;
    var highest = 0;
    for (var key in valuesMap) {
      var range = parseInt(key);
      if (valuesMap[key]) {
        highest = range > 0 ? range : 1;
      }
    }
    return highest;
""";

SELECT build_id,
sum (case when highest >= 64000 then 1 else 0 end) as v_64000ms_or_higher,
sum (case when highest >= 27856 and highest < 64000 then 1 else 0 end) as v_27856ms_to_63999ms,
sum (case when highest >= 12124 and highest < 27856 then 1 else 0 end) as v_12124ms_to_27855ms,
sum (case when highest >= 5277 and highest < 12124 then 1 else 0 end) as v_5277ms_to_12123ms,
sum (case when highest >= 2297 and highest < 5277 then 1 else 0 end) as v_2297ms_to_5276ms,
sum (case when highest >= 1000 and highest < 2297 then 1 else 0 end) as v_1000ms_to_2296ms,
sum (case when highest > 0 and highest < 50 then 1 else 0 end) as v_0ms_to_49ms,
sum (case when highest >= 50 and highest < 100 then 1 else 0 end) as v_50ms_to_99ms,
sum (case when highest >= 100 and highest < 200 then 1 else 0 end) as v_100ms_to_199ms,
sum (case when highest >= 200 and highest < 400 then 1 else 0 end) as v_200ms_to_399ms,
sum (case when highest >= 400 and highest < 800 then 1 else 0 end) as v_400ms_to_799ms,
count(*) as count
from
(select build_id, client_id, max(greatest(highest_long, highest_short)) as highest
from
(SELECT
    SUBSTR(application.build_id, 0, 8) as build_id,
    client_id,
    udf_js_json_extract_highest_long_spinner(payload.histograms.FX_TAB_SWITCH_SPINNER_VISIBLE_LONG_MS) AS highest_long,
    udf_js_json_extract_highest_long_spinner(payload.histograms.FX_TAB_SWITCH_SPINNER_VISIBLE_MS) as highest_short
FROM telemetry.main
WHERE
    application.channel='nightly'
    AND normalized_os='Windows'
    AND application.build_id > FORMAT_DATE("%Y%m%d", DATE_SUB(CURRENT_DATE(), INTERVAL 2 QUARTER))
    AND DATE(submission_timestamp) >= DATE_SUB(CURRENT_DATE(), INTERVAL 2 QUARTER))
group by build_id, client_id) group by build_id;
In addition to being much simpler, this new job is also way cheaper. The last run of it scanned just over 1 TB of data, meaning it cost us just over $5. Not as cheap as I might like, but considerably less expensive than before: I’ve also scheduled it to only run once every other day, since Mike tells me he doesn’t need this data any more often than that.
[1] I understand that Jeff Klukas, Frank Bertsch, Daniel Thorn, Anthony Miyaguchi, and Wesley Dawson are the principals involved - apologies if I’m forgetting someone.