Over the past two weeks, I’ve been working a bit on the Treeherder front end (our interface to managing build and test jobs from mercurial changesets), trying to help get things in shape so that the sheriffs can feel comfortable transitioning to it from tbpl by the end of the quarter.
One thing that has pleasantly surprised me is just how easy it’s been to get going and be productive. The process looks like this on Linux or Mac:
git clone https://github.com/mozilla/treeherder-ui.git
cd treeherder-ui/webapp
./scripts/web-server.js
Then just load http://localhost:8000 in your favorite web browser (Firefox) and you should be good to go (it will load data from the actually treeherder site). If you want to make modifications to the HTML, Javascript, or CSS just go ahead and do so with your favorite editor and the changes will be immediately reflected.
We have a fair backlog of issues to get through, many of them related to the front end. If you’re interested in helping out, please have a look:
If nothing jumps out at you, please drop by irc.mozilla.org #treeherder and we can probably find something for you to work on. We’re most active during Pacific Time working hours.
I had some time on my hands two weekends ago and was feeling a bit of an itch to build something, so I decided to do a project I’ve had in the back of my head for a while: a meditation timer.
If you’ve been following this log, you’d know that meditation has been a pretty major interest of mine for the past year. The foundation of my practice is a daily round of seated meditation at home, where I have been attempting to follow the breath and generally try to connect with the world for a set period every day (usually varying between 10 and 30 minutes, depending on how much of a rush I’m in).
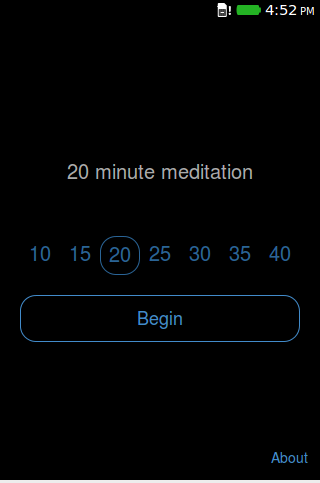
Clock watching is rather distracting while sitting so having a tool to notify you when a certain amount of time has elapsed is quite useful. Writing a smartphone app to do this is an obvious idea, and indeed approximately a zillion of these things have been written for Android and iOS. Unfortunately, most are not very good. Really, I just want something that does this:
Select a meditation length (somewhere between 10 and 40 minutes).
Sound a bell after a short preparation to demarcate the beginning of meditation.
While the meditation period is ongoing, do a countdown of the time remaining (not strictly required, but useful for peace of mind in case you’re wondering whether you’ve really only sat for 25 minutes).
Sound a bell when the meditation ends.
Yes, meditation can get more complex than that. In Zen practice, for example, sometimes you have several periods of varying length, broken up with kinhin (walking meditation). However, that mostly happens in the context of a formal setting (e.g. a Zendo) where you leave your smartphone at the door. Trying to shoehorn all that into an app needlessly complicates what should be simple.
Even worse are the apps which “chart” your progress or have other gimmicks to connect you to a virtual “community” of meditators. I have to say I find that kind of stuff really turns me off. Meditation should be about connecting with reality in a more fundamental way, not charting gamified statistics or interacting online. We already have way too much of that going on elsewhere in our lives without adding even more to it.
So, you might ask why the alarm feature of most clock apps isn’t sufficient? Really, it is most of the time. A specialized app can make selecting the interval slightly more convenient and we can preselect an appropriate bell sound up front. It’s also nice to hear something to demarcate the start of a meditation session. But honestly I didn’t have much of a reason to write this other than the fact than I could. Outside of work, I’ve been in a bit of a creative rut lately and felt like I needed to build something, anything and put it out into the world (even if it’s tiny and only a very incremental improvement over what’s out there already). So here it is:
The app was written entirely in HTML5 so it should work fine on pretty much any reasonably modern device, desktop or mobile. I tested it on my Nexus 5 (Chrome, Firefox for Android)1, FirefoxOS Flame, and on my laptop (Chrome, Firefox, Safari). It lives on a subdomain of this site or you can grab it from the Firefox Marketplace if you’re using some variant of Firefox (OS). The source, such as it is, can be found on github.
I should acknowledge taking some design inspiration from the Mind application for iOS, which has a similarly minimalistic take on things. Check that out too if you have an iPhone or iPad!
Happy meditating!
1 Note that there isn’t a way to inhibit the screen/device from going to sleep with these browsers, which means that you might miss the ending bell. On FirefoxOS, I used the requestWakeLock API to make sure that doesn’t happen. I filed a bug to get this implemented on Firefox for Android.
Rogers, my previous cell phone provider, is ridiculous.
So for those of you who don’t know, I just moved from Montreal to Toronto. There are very few people who call me these days, but some still do and keeping my old Montreal number subjects me to a bunch of long distance fees I didn’t want to pay every time someone dials my number while I’m here.
I really didn’t want to go to the trouble of changing my cellphone company, so was ready to just switch my number and keep my $60/mo. plan with Rogers. I knew it was kind of expensive, but they haven’t given me much trouble and I do put a premium on my time not being occupied with changing service providers. I also figured I had bigger fish to fry in terms of finding budgetary savings.
But no, apparently the “market” in Ontario is “less competitive”, so my plan doesn’t exist here. After an hour and several levels of polite escalation (in strict violation of the “don’t waste my time” rule), the best they could give me was a $70/mo. plan (a $10 increase) with a decrease of 3gb data -> 2gb. I gave them plenty of opportunities to relent, but they wouldn’t budge. They claimed there was no reasonable alternative.
Did some shopping around: unfortunately Wind (the best value) didn’t seem to work with my Nexus 5, so I went with Virgin Mobile who looked like the next best option. Up and running in just half an hour, and will probably be paying no more than $50 a month now.
So what happened to the legendary Rogers customer retention department? How do they think they can get away charging these kinds of rates?
[ For more information on the Eideticker software I’m referring to, see this entry ]
Just wanted to write up a few notes on using Eideticker to measure animation smoothness, since this is a topic that comes up pretty often and I wind up explaining these things repeatedly. 😉
When rendering web content, we want the screen to update something like 60 times per second (typical refresh rate of an LCD screen) when an animation or other change is occurring. When this isn’t happening, there is often a user perception of jank (a.k.a. things not working as they should). Generally we express how well we measure up to this ideal by counting the number of “frames per second” that we’re producing. If you’re reading this, you’re probably already familiar with the concept in outline. If you want to know more, you can check out the wikipedia article which goes into more detail.
At an internal level, this concept matches up conceptually with what Gecko is doing. The graphics pipeline produces frames inside graphics memory, which is then sent to the LCD display (whether it be connected to a laptop or a mobile phone) to be viewed. By instrumenting the code, we can see how often this is happening, and whether it is occurring at the right frequency to reach 60 fps. My understanding is that we have at least some code which does exactly this, though I’m not 100% up to date on how accurate it is.
But even assuming the best internal system monitoring, Eideticker might still be useful because:
It is more “objective”. This is valuable not only for our internal purposes to validate other automation (sometimes internal instrumentation can be off due to a bug or whatever), but also to “prove” to partners that our software has the performance characteristics that we claim.
Unfortunately, deriving this sort of information from a video capture is more complicated than you’d expect.
What does frames per second even mean?
Given a set of N frames captured from the device, the immediate solution when it comes to “frames per second” is to just compare frames against each other (e.g. by comparing the value of individual pixels) and then counting the ones that are different as “unique frames”. Divide the total number of unique frames by the length of the
capture and… voila? Frames per second? Not quite.
First off, there’s the inherent problem that sometimes the expected behaviour of a test is for the screen to be unchanging for a period of time. For example, at the very beginning of a capture (when we are waiting for the input event to be acknowledged) and at the end (when we are waiting for things to settle). Second, it’s also easy to imagine the display remaining static for a period of time in the middle of a capture (say in between gestures in a multi-part capture). In these cases, there will likely be no observable change on the screen and thus the number of frames counted will be artificially low, skewing the frames per second number down.
Measurement problems
Ok, so you might not consider that class of problem that big a deal. Maybe we could just not consider the frames at the beginning or end of the capture. And for pauses in the middle, as long as we get an absolute number at the end, we’re fine right? That’s at least enough to let us know that we’re getting better or worse, assuming that whatever we’re testing is behaving the same way between runs and we’re just trying to measure how many frames hit the screen.
I might agree with you there, but there’s a further problems that are specific to measuring on-screen performance using a high-speed camera as we are currently with FirefoxOS.
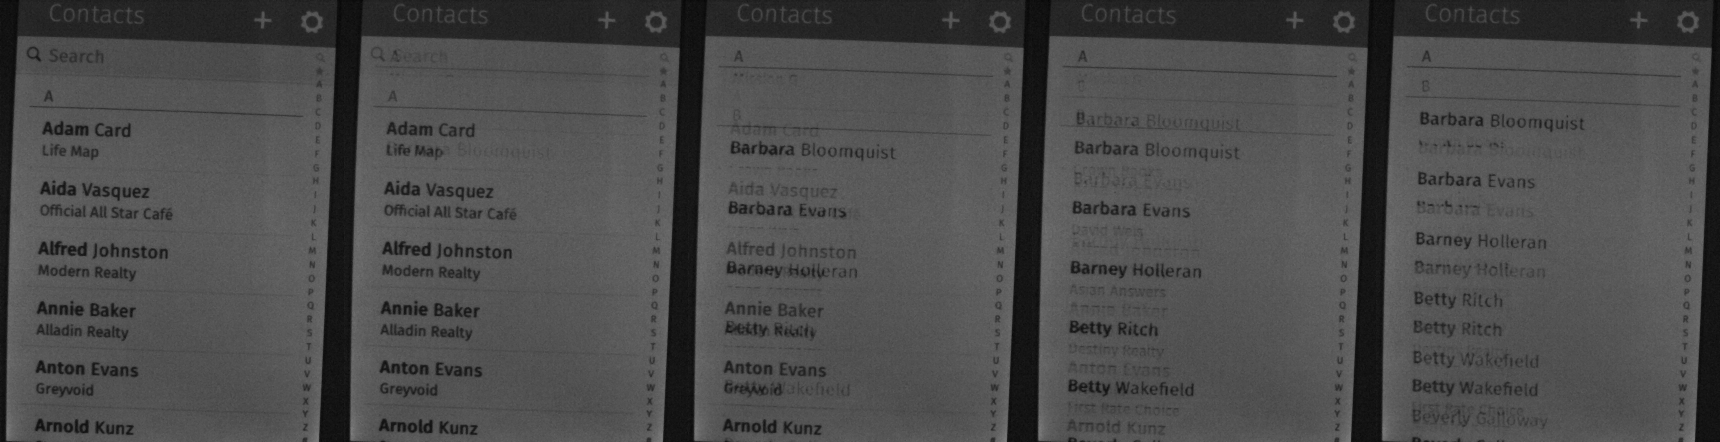
An LCD updates gradually, and not all at once. Remnants of previous frames will remain on screen long past their interval. Take for example these five frames (sampled at 120fps) from a capture of a pan down in the FirefoxOS Contacts application (movie):
Note how if you look closely these 5 frames are actually the intersection of *three* seperate frames. One with “Adam Card” at the top, another with “Barbara Bloomquist” at the top, then another with “Barbara Bloomquist” even further up. Between each frame, artifacts of the previous one are clearly visible.
Plausible sounding solutions:
Try to resolve the original images by distinguishing “new” content from ghosting artifacts. Sounds possible, but probably hard? I’ve tried a number of simplistic techniques (i.e. trying to find times when change is “peaking”), but nothing has really worked out very well.
Somehow reverse engineering the interface between the graphics chipset and the LCD panel, and writing some kind of custom hardware to “capture” the framebuffer as it is being sent from one to the other. Also sounds difficult.
Just forget about this problem altogether and only try to capture periods of time in the capture where the image has stayed static for a sustained period of time (i.e. for say 4–5 frames and up) and we’re pretty sure it’s jank.
Personally the last solution appeals to me the most, although it has the obvious disadvantage of being a “homebrew” metric that no one has ever heard of before, which might make it difficult to use to prove that performance is adequate — the numbers come with a long-winded explanation instead of being something that people immediately understand.
[ For more information on the Eideticker software I’m referring to, see this entry ]
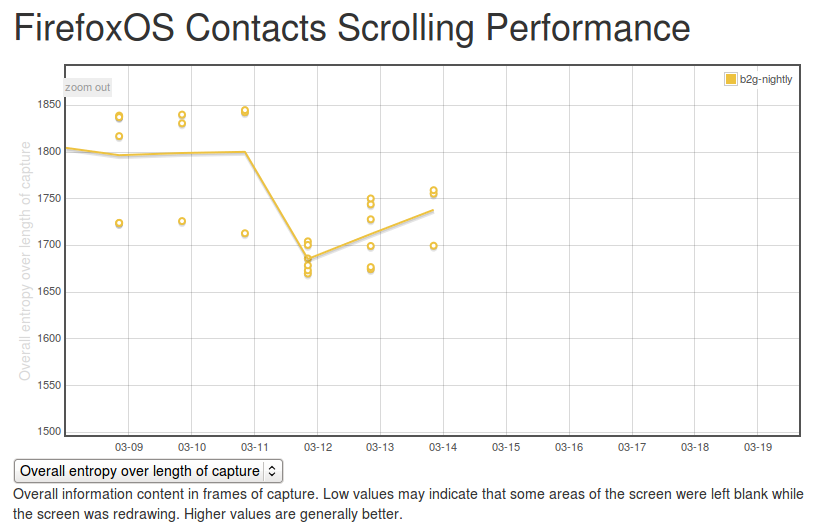
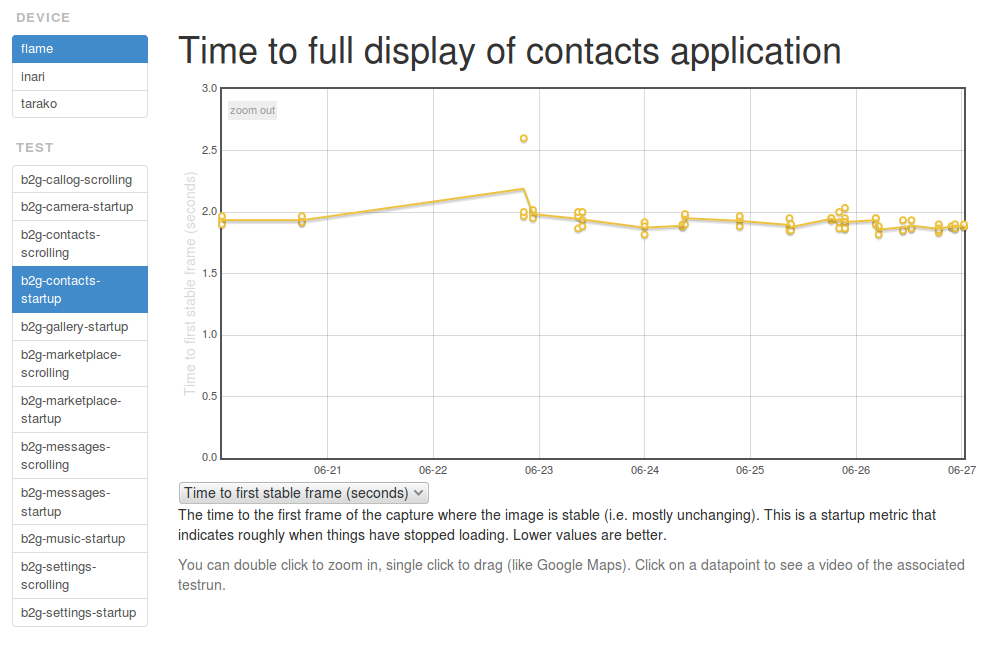
Just wanted to give an update on where Eideticker is at the end of Q2 2014. The big news is that we’ve started to run startup tests against the Flame, the results of which are starting to appear on the dashboard:
It is expected that these tests will provide a useful complement to the existing startup tests we’re running with b2gperf, in particular answering the “is this regression real?” question.
Pending work for Q3:
Enable scrolling tests on the Flame. I got these working against the Hamachi a few months ago but because of some weird input issue we’re seeing we can’t yet enable them on the Flame. This is being tracked in bug 1028824. If anyone has background on the behaviour of the touch screen driver for this device I would appreciate some help.
Enable tests for multiple branches on the Flame (currently we’re only doing master). This is pretty much ready to go (bug 1017834), just need to land it.
Annotate eideticker graphs with internal benchmark information. Eli Perelman of the FirefoxOS performance team has come up with a standard set of on-load events for the Gaia apps (app chrome loaded, app content loaded, …) that each app will generate, feeding into tools like b2gperf and test-perf. We want to show this information in Eideticker’s frame-by-frame analysis (example) so we can verify that the app’s behaviour is consistent with what it is claimed. This is being tracked in bug 1018334
Re-enable Eideticker for Android and run tests more frequently. Sadly we haven’t been consistently generating new Eideticker results for Android for the last quarter because of networking issues in the new Mountain View office, where the test rig for those live. One way or another, we want to fix this next quarter and hopefully run tests more frequently against mozilla-inbound (instead of just nightly builds)
The above isn’t an exhaustive list: there’s much more that we have in mind for the future that’s not yet scheduled or defined well (e.g. get Eideticker reporting to Treeherder’s new performance module). If you have any questions or feedback on anything outlined above I’d love to hear it!
Just wanted to make a quick announcement that ManifestDestiny, the python package we use internally here at Mozilla for declaratively managing lists of tests in Mochitest and other places, has been renamed to manifestparser. We kept the versioning the same (0.6), so the only thing you should need to change in your python package dependencies is a quick substitution of “ManifestDestiny” with “manifestparser”. We will keep ManifestDestiny around indefinitely on pypi, but only to make sure old stuff doesn’t break. New versions of the software will only be released under the name “manifestparser”.
Quick history lesson: “Manifest destiny” refers to a philosophy of exceptionalism and expansionism that was widely held by American settlers in the 19th century. The concept is considered offensive by some, as it was used to justify displacing and dispossessing Native Americans. Wikipedia’s article on the subject has a good summary if you want to learn more.
Here at Mozilla Tools & Automation, we’re most interested in creating software that everyone can feel good about depending on, so we agreed to rename it. When I raised this with my peers, there were no objections. I know these things are often the source of much drama in the free software world, but there’s really none to see here.
Just wanted to give some quick updates on mozregression, your favorite regression-finding tool for Firefox:
I moved all issue tracking in mozregression to bugzilla from github issues. Github unfortunately doesn’t really scale to handle notifications sensibly when you’re part of a large organization like Mozilla, which meant many problems were flying past me unseen. File your new bugs in bugzilla, they’re now much more likely to be acted upon.
Sam Garrett has stepped up to be co-maintainer of the project with me. He’s been doing a great job whacking out a bunch of bugs and keeping things running reliably, and it was time to give him some recognition and power to keep things moving forward.
On that note, I just released mozregression 0.17, which now shows the revision number when running a build (a request from the graphics team, bug 1007238) and handles respins of nightly builds correctly (bug 1000422). Both of these were fixed by Sam.
If you’re interested in contributing to Mozilla and are somewhat familiar with python, mozregression is a great place to start. The codebase is quite approachable and the impact will be high — as I’ve found out over the last few months, people all over the Mozilla organization (managers, developers, QA) use it in the course of their work and it saves tons of their time. A list of currently open bugs is here.
This year’s PyCon US (Python Conference) was in my city of residence (Montréal) so I took the opportunity to go and see what was up in the world of the language I use the most at Mozilla. It was pretty great!
ipython
The highlight for me was learning about the possibilities of ipython notebooks, an absolutely fantastic interactive tool for debugging python in a live browser-based environment. I’d heard about it before, but it wasn’t immediately apparent how it would really improve things — it seemed to be just a less convenient interface to the python console that required me to futz around with my web browser. Watching a few presentations on the topic made me realize how wrong I was. It’s already changed the way I do work with Eideticker data, for the better.
[][3]
Using ipython to analyze some eideticker data
I think the basic premise is really quite simple: a better interface for typing in, experimenting with, and running python code. If you stop and think about it, the modern web interface supports a much richer vocabulary of interactive concepts that the console (or even text editors like emacs): there’s no reason we shouldn’t take advantage of it.
Here are the (IMO) killer features that make it worth using:
The ability to immediately re-execute a block of code after editing and seeing an error (essentially merging the immediacy of the python console with the permanency / cut & pastability of an actual script)
Live-printing out graphs of numerical results using matplotlib. ZOMG this is so handy. Especially in conjunction with the live-editing outlined above, there’s no better tool for fine-tuning mathematical/statistical analysis.
The shareability of the results. Any ipython notebook can be saved and then saved to a public website. Many presentations at PyCon 2014, in fact, were done entirely with ipython notebooks. So handy for answering questions like “how did you get that”?
I saw some other good talks at the conference, here are some of them:
All Your Ducks In A Row: Data Structures in the Standard Library and Beyond : A useful talk by Brandon Rhoades on the implementation of basic data structures in Python, and how to select the ones to use for optimal performance. It turns out that lists aren’t the best thing to use for long sequences of numerical data (who knew?)
Fast Python, Slow Python : An interesting talk by Alex Gaynor about how to write decent performing pure-python code in a single-threaded context. Lots of intelligent stuff about producing robust code that matches your intention and data structures, and caution against doing fancy things in the name of being “pythonic” or “general”.
Analyzing Rap Lyrics with Python : Another data analysis talk, this one about a subject I knew almost nothing about. The best part of it (for me anyway) was learning how the speaker (Julie Lavoie) narrowed her focus in her research to the exact aspects of the problem that would let her answer the question she was interested in (“Can we automatically find out which rap lyrics are the most sexist?”) as opposed to interesting problems (“how can I design the most general scraping library possible?”) that don’t answer the question. In my opinion, this ability to focus is one of the key things that seperates successful projects from unsuccessful ones.
Just a quick note that I’ll shortly be travelling from the frozen land of Montreal, Canada to Japan and Taiwan over the next week, with no particular agenda other than to explore and meet people. If any Mozillians are interested in meeting up for food or drink, and discussion of FirefoxOS performance, Eideticker, entropy or anything else, feel free to contact me at wrlach@gmail.com.
Exact itinerary:
Thu Mar 20 : Sat Mar 22: Tokyo, Japan
Sat Mar 22 : Tue Mar 25: Kyoto, Japan
Tue Mar 25 : Thu Mar 27: Tokyo, Japan
Thu Mar 27 : Sun Mar 30: Taipei, Taiwan
I will also be in Taipei the week of the March 31st, though I expect most of my time to be occupied with discussions/activities inside the Taipei office about FirefoxOS performance matters (the Firefox performance team is having a work week there, and I’m tagging along to talk about / hack on Eideticker and other automation stuff).
[ For more information on the Eideticker software I’m referring to, see this entry ]
So recently I’ve been exploring new and different methods of measuring things that we care about on FirefoxOS — like startup time or amount of checkerboarding. With Android, where we have a mostly clean signal, these measurements were pretty straightforward. Want to measure startup times? Just capture a video of Firefox starting, then compare the frames pixel by pixel to see how much they differ. When the pixels aren’t that different anymore, we’re “done”. Likewise, to measure checkerboarding we just calculated the areas of the screen where things were not completely drawn yet, frame-by-frame.
On FirefoxOS, where we’re using a camera to measure these things, it has not been so simple. I’ve already discussed this with respect to startup time in a previous post. One of the ideas I talk about there is “entropy” (or the amount of unique information in the frame). It turns out that this is a pretty deep concept, and is useful for even more things than I thought of at the time. Since this is probably a concept that people are going to be thinking/talking about for a while, it’s worth going into a little more detail about the math behind it.
The wikipedia article on information theoretic entropy is a pretty good introduction. You should read it. It all boils down to this formula:
You can see this section of the wikipedia article (and the various articles that it links to) if you want to break down where that comes from, but the short answer is that given a set of random samples, the more different values there are, the higher the entropy will be. Look at it from a probabilistic point of view: if you take a random set of data and want to make predictions on what future data will look like. If it is highly random, it will be harder to predict what comes next. Conversely, if it is more uniform it is easier to predict what form it will take.
Another, possibly more accessible way of thinking about the entropy of a given set of data would be “how well would it compress?”. For example, a bitmap image with nothing but black in it could compress very well as there’s essentially only 1 piece of unique information in it repeated many times — the black pixel. On the other hand, a bitmap image of completely randomly generated pixels would probably compress very badly, as almost every pixel represents several dimensions of unique information. For all the statistics terminology, etc. that’s all the above formula is trying to say.
So we have a model of entropy, now what? For Eideticker, the question is — how can we break the frame data we’re gathering down into a form that’s amenable to this kind of analysis? The approach I took (on the recommendation of this article) was to create a histogram with 256 bins (representing the number of distinct possibilities in a black & white capture) out of all the pixels in the frame, then run the formula over that. The exact function I wound up using looks like this:
def _get_frame_entropy((i, capture, sobelized)):
    frame = capture.get_frame(i, True).astype('float')
    if sobelized:
        frame = ndimage.median_filter(frame, 3)

        dx = ndimage.sobel(frame, 0)  # horizontal derivative
        dy = ndimage.sobel(frame, 1)  # vertical derivative
        frame = numpy.hypot(dx, dy)  # magnitude
        frame *= 255.0 / numpy.max(frame)  # normalize (Q&D)

    histogram = numpy.histogram(frame, bins=256)[0]
    histogram_length = sum(histogram)
    samples_probability = [float(h) / histogram_length for h in histogram]
    entropy = -sum([p * math.log(p, 2) for p in samples_probability if p != 0])

    return entropy
The “sobelized” bit allows us to optionally convolve the frame with a sobel filter before running the entropy calculation, which removes most of the data in the capture except for the edges. This is especially useful for FirefoxOS, where the signal has quite a bit of random noise from ambient lighting that artificially inflate the entropy values even in places where there is little actual “information”.
This type of transformation often reveals very interesting information about what’s going on in an eideticker test. For example, take this video of the user panning down in the contacts app:
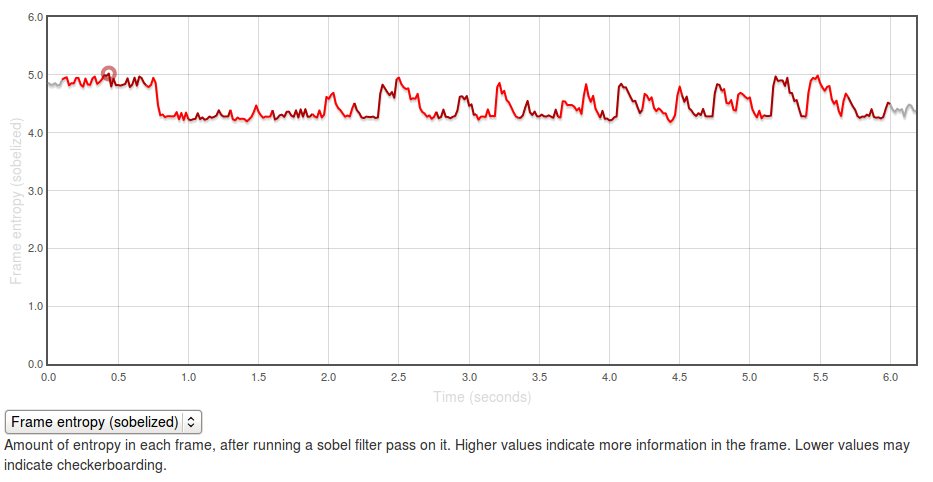
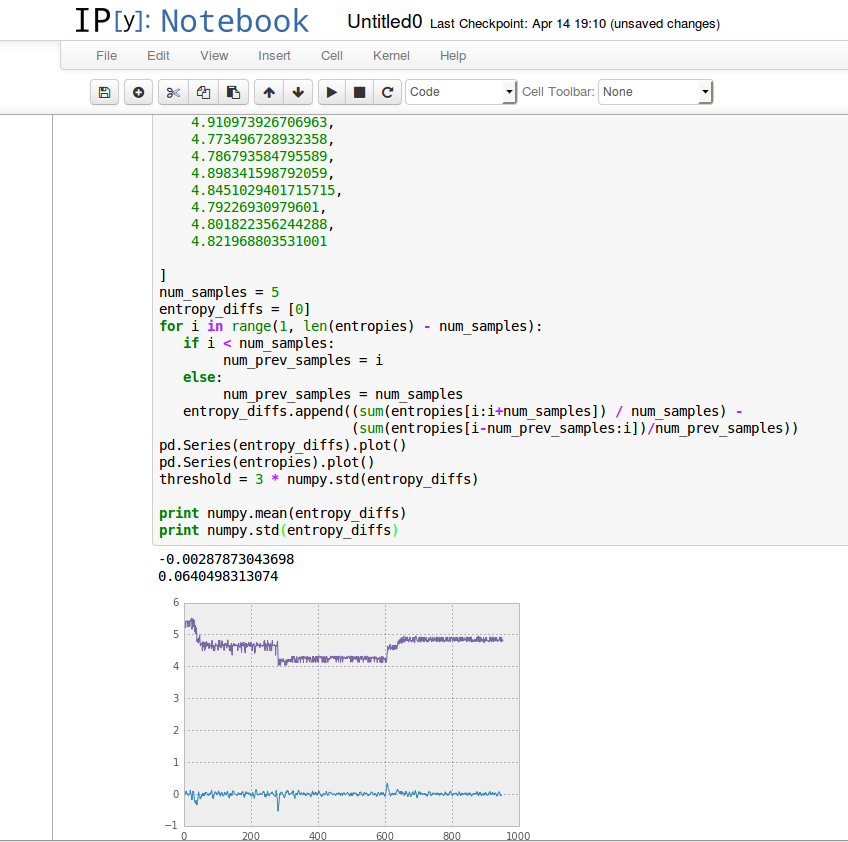
If you graph the entropies of the frame of the capture using the formula above you, you get a graph like this:
The Y axis represents entropy, as calculated by the code above. There is no inherently “right” value for this — it all depends on the application you’re testing and what you expect to see displayed on the screen. In general though, higher values are better as it indicates more frames of the capture are “complete”.
The region at the beginning where it is at about 5.0 represents the contacts app with a set of contacts fully displayed (at startup). The “flat” regions where the entropy is at roughly 4.25? Those are the areas where the app is “checkerboarding” (blanking out waiting for graphics or layout engine to draw contact information). Click through to the original and swipe over the graph to see what I mean.
It’s easy to see what a hypothetical ideal end state would be for this capture: a graph with a smooth entropy of about 5.0 (similar to the start state, where all contacts are fully drawn in). We can track our progress towards this goal (or our deviation from it), by watching the eideticker b2g dashboard and seeing if the summation of the entropy values for frames over the entire test increases or decreases over time. If we see it generally increase, that probably means we’re seeing less checkerboarding in the capture. If we see it decrease, that might mean we’re now seeing checkerboarding where we weren’t before.
It’s too early to say for sure, but over the past few days the trend has been positive:
(note that there were some problems in the way the tests were being run before, so results before the 12th should not be considered valid)
So one concept, at least two relevant metrics we can measure with it (startup time and checkerboarding). Are there any more? Almost certainly, let’s find them!
 ][3]
][3]